Confluent: Clickstream Data Analysis Pipeline Using ksqlDB
This lab was developed with our partner, Confluent. Your personal information may be shared with Confluent, the lab sponsor, if you have opted-in to receive product updates, announcements, and offers in your Account Profile.
GSP731

Overview
This lab will cover how to create a clickstream data analysis pipeline using ksqlDB. First, you will run multiple Docker containers and create source connectors that generate clickstream data, which you will be able to view in the Confluent Control Center UI. You will then load the data into ksqlDB, and verify that it is being streamed through various tables and streams. Next, you will send the ksqlDB tables to Elasticsearch and Grafana via the ksqlDB REST API. Lastly, you will view the streaming data in the Grafana dashboard.
What you'll learn
In this lab, you will:
- Download and run the Confluent tutorial
- Create mock clickstream data
- Load the streaming data to ksqlDB
- Send the ksqlDB tables to Elasticsearch and Grafana
- Sessionize the data
- View the data in Grafana
Setup and requirements
Before you click the Start Lab button
Read these instructions. Labs are timed and you cannot pause them. The timer, which starts when you click Start Lab, shows how long Google Cloud resources will be made available to you.
This hands-on lab lets you do the lab activities yourself in a real cloud environment, not in a simulation or demo environment. It does so by giving you new, temporary credentials that you use to sign in and access Google Cloud for the duration of the lab.
To complete this lab, you need:
- Access to a standard internet browser (Chrome browser recommended).
- Time to complete the lab---remember, once you start, you cannot pause a lab.
How to start your lab and sign in to the Google Cloud console
-
Click the Start Lab button. If you need to pay for the lab, a pop-up opens for you to select your payment method. On the left is the Lab Details panel with the following:
- The Open Google Cloud console button
- Time remaining
- The temporary credentials that you must use for this lab
- Other information, if needed, to step through this lab
-
Click Open Google Cloud console (or right-click and select Open Link in Incognito Window if you are running the Chrome browser).
The lab spins up resources, and then opens another tab that shows the Sign in page.
Tip: Arrange the tabs in separate windows, side-by-side.
Note: If you see the Choose an account dialog, click Use Another Account. -
If necessary, copy the Username below and paste it into the Sign in dialog.
{{{user_0.username | "Username"}}} You can also find the Username in the Lab Details panel.
-
Click Next.
-
Copy the Password below and paste it into the Welcome dialog.
{{{user_0.password | "Password"}}} You can also find the Password in the Lab Details panel.
-
Click Next.
Important: You must use the credentials the lab provides you. Do not use your Google Cloud account credentials. Note: Using your own Google Cloud account for this lab may incur extra charges. -
Click through the subsequent pages:
- Accept the terms and conditions.
- Do not add recovery options or two-factor authentication (because this is a temporary account).
- Do not sign up for free trials.
After a few moments, the Google Cloud console opens in this tab.

Activate Cloud Shell
Cloud Shell is a virtual machine that is loaded with development tools. It offers a persistent 5GB home directory and runs on the Google Cloud. Cloud Shell provides command-line access to your Google Cloud resources.
- Click Activate Cloud Shell
at the top of the Google Cloud console.
When you are connected, you are already authenticated, and the project is set to your Project_ID,
gcloud is the command-line tool for Google Cloud. It comes pre-installed on Cloud Shell and supports tab-completion.
- (Optional) You can list the active account name with this command:
- Click Authorize.
Output:
- (Optional) You can list the project ID with this command:
Output:
gcloud, in Google Cloud, refer to the gcloud CLI overview guide.
- Close the main Navigation Menu (
) by clicking the three lines at the top left of the screen (hamburger), next to the Google Cloud logo.
Task 1. Download and run the tutorial
The tutorial is built using Docker Compose. It brings together several Docker images with the required networking and dependencies. The images are quite large and depending on your network connection may take a few minutes to download.
- In Cloud Shell, clone the Confluent examples repository:
- Navigate to the
examples/clickstreamdirectory and switch to the Confluent Platform release branch:
- Use a
sedcommand to change the client version.
- Run the below command to update the grafana port.
- Get the Jar files for
kafka-connect-datagen(source connector) andkafka-connect-elasticsearch(sink connector):
- Increase the virtual memory for
elasticsearchsink connector:
- Now, launch the tutorial in Docker:
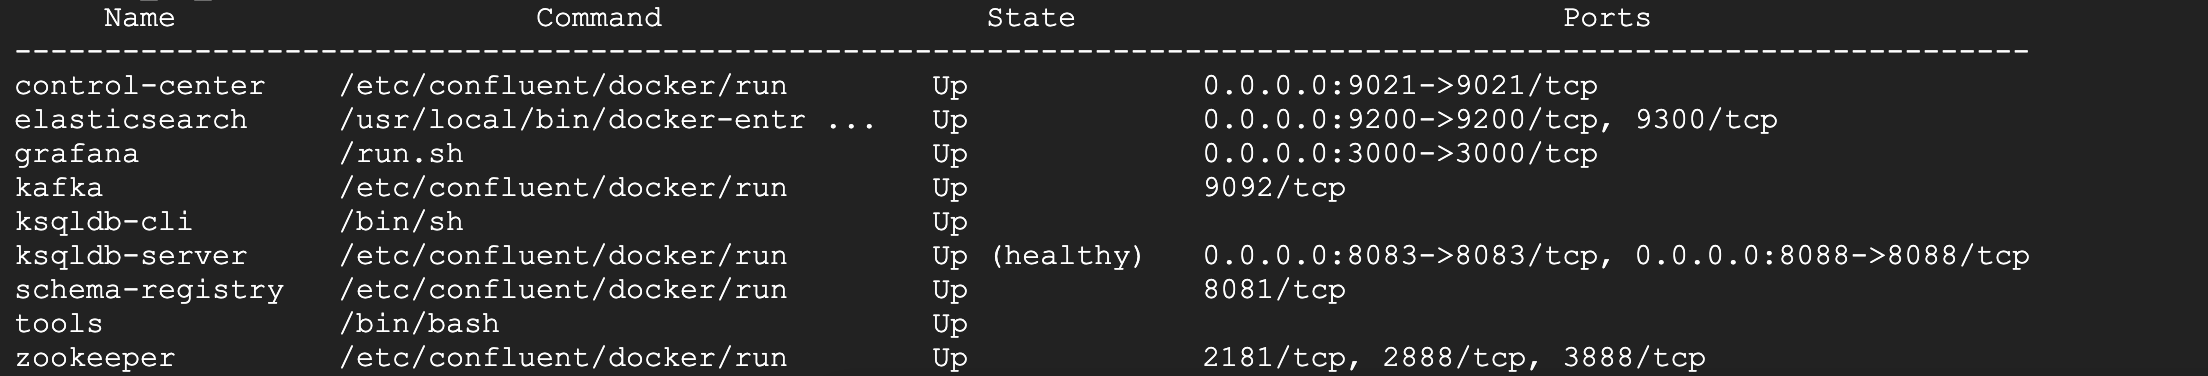
- After a minute or so, run the
docker-compose psstatus command to ensure that everything has started correctly:
Your output should resemble:
Task 2. Create the Clickstream data
Once you've confirmed all the Docker containers are running, create the source connectors that generate mock data. This lab leverages the embedded Connect worker in ksqlDB.
- Launch the ksqlDB CLI:
- Run the script create-connectors.sql that executes the ksqlDB statements to create three source connectors for generating mock data:
The output will be similar to this:
- After the
RUN SCRIPTcommand completes, exit out of the ksqldb-cli with theCTRL+Dcommand. You can also typeexitin the prompt to go back to your terminal. Now the clickstream generator is running, simulating the stream of clicks. Sample these messages in clickstream:
- The second data generator running is for the HTTP status codes. Sample these messages in
clickstream_codesto view the HTTP status codes:
Your output should resemble something like the following:
- The third data generator is for the user information. Samples these messages in
clickstream_usersto view the user information:
Your output should resemble:
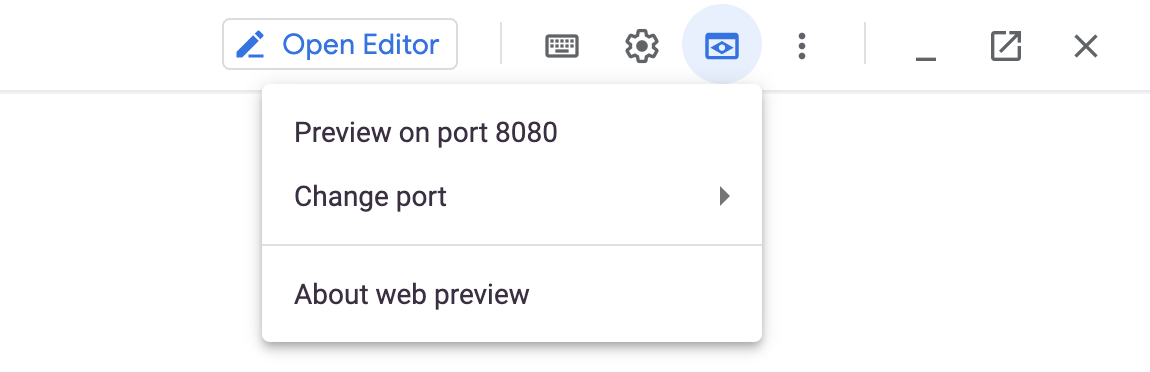
- Go to the Confluent Control Center UI. Click
Web Previewin Cloud Shell, then clickPreview on port 8080. It should open up a new page.
-
Now, in the URL, change the beginning of the line from
8080to9021and refresh the page. Your URL should now look something like:https://9021-cs-5ed290dd-ea41-43ed-9788-1e8245e4bc27.ql-asia-southeast1-dsfl.cloudshell.dev/?authuser=0. -
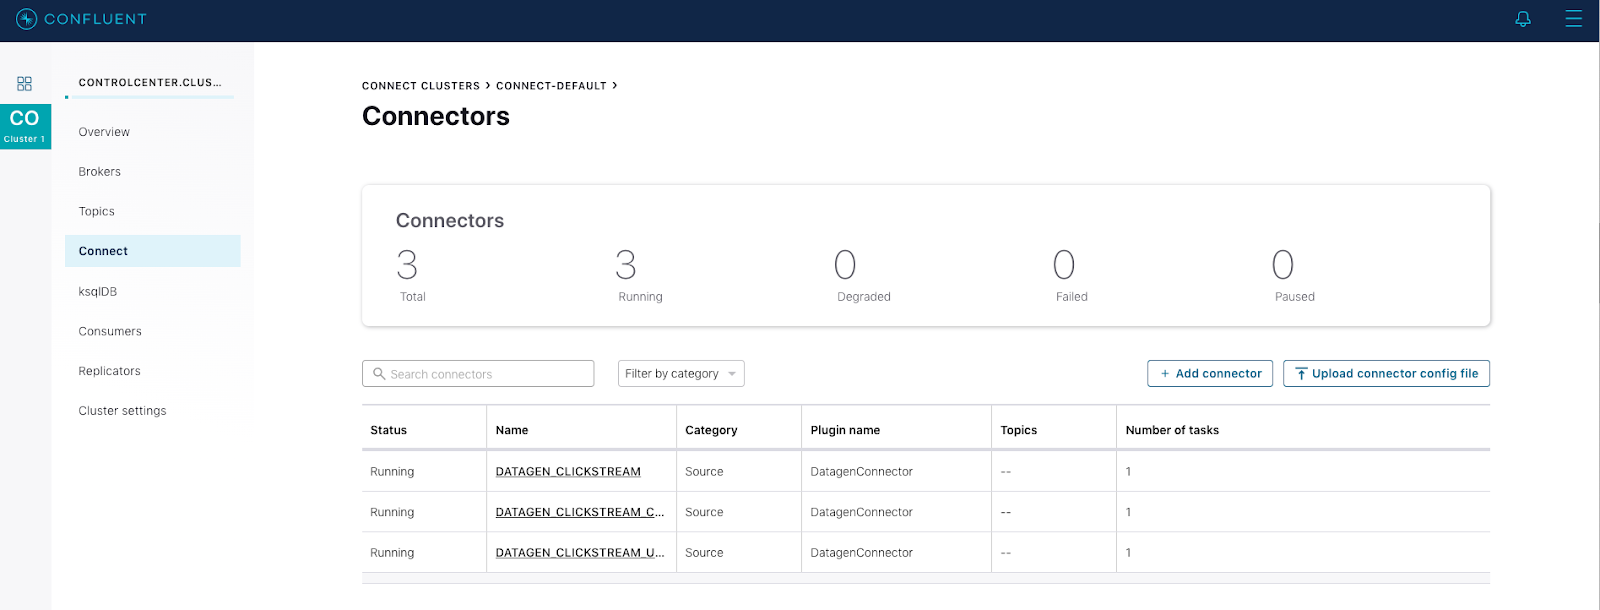
Click Cluster 1 > Connect > connect-default.
You should now be able to view the three kafka-connect-datagen source connectors created with the ksqlDB CLI.
Task 3. Load the streaming data to ksqlDB
- Back in Cloud Shell, launch the ksqlDB CLI:
- Load the statements.sql file that runs the tutorial app. Important: before running this step, you must have already run ksql-datagen utility to create the clickstream data, status codes, and set of users.
Verify the data
-
Go back to the Confluent Control Center UI. Navigate to the ksqlDB menu, click on your clickstream application, and then click on
Flow. -
Go back to the ksqlDB CLI and verify that data is being streamed through various tables and streams. Query one of the streams
CLICKSTREAM:
- Press
CTRL+Dto terminate the above Query.
Task 4. Load the Clickstream data in Grafana
In this section, you'll send the ksqlDB tables to Elasticsearch and Grafana.
-
Exit the ksqldb-cli with the
CTRL+Dcommand. You can also typeexitin the prompt to go back to your terminal. -
Set up the required Elasticsearch document mapping template:
- Run this command to send the ksqlDB tables to Elasticsearch and Grafana:
- Now, you can the dashboard into Grafana:
- In the Confluent Control Center UI, view the running connectors again. The three kafka-connect-datagen source connectors were created with the
ksqlDB CLI, and the seven Elasticsearch sink connectors were created with theksqlDB REST API.
Task 5. Sessionize the data
One of the tables created by the demo, CLICK_USER_SESSIONS, shows a count of user activity for a given user session. All clicks from the user count towards the total user activity for the current session. If a user is inactive for 30 seconds, then any subsequent click activity is counted towards a new session.
The clickstream demo simulates user sessions with a script. The script pauses the DATAGEN_CLICKSTREAM connector every 90 seconds for a 35 second period of inactivity. By stopping the DATAGEN_CLICKSTREAMconnector for some time greater than 30 seconds, you will see distinct user sessions.
You'll probably use a longer inactivity gap for session windows in practice. But the demo uses 30 seconds so you can see the sessions in action in a reasonable amount of time.
Session windows are different because they monitor user behavior and other window implementations consider only time.
- To generate the session data execute the following statement from the
examples/clickstreamdirectory. The script will issue some statements to the console about where it is in the process.
Task 6. View the data in Grafana
-
Navigate to the Grafana dashboard. In Cloud Shell, click
Web Preview, then clickChange portand enter4000. Click CHANGE AND PREVIEW. -
The Grafana login interface should appear. You can login with user ID
userand passworduser. -
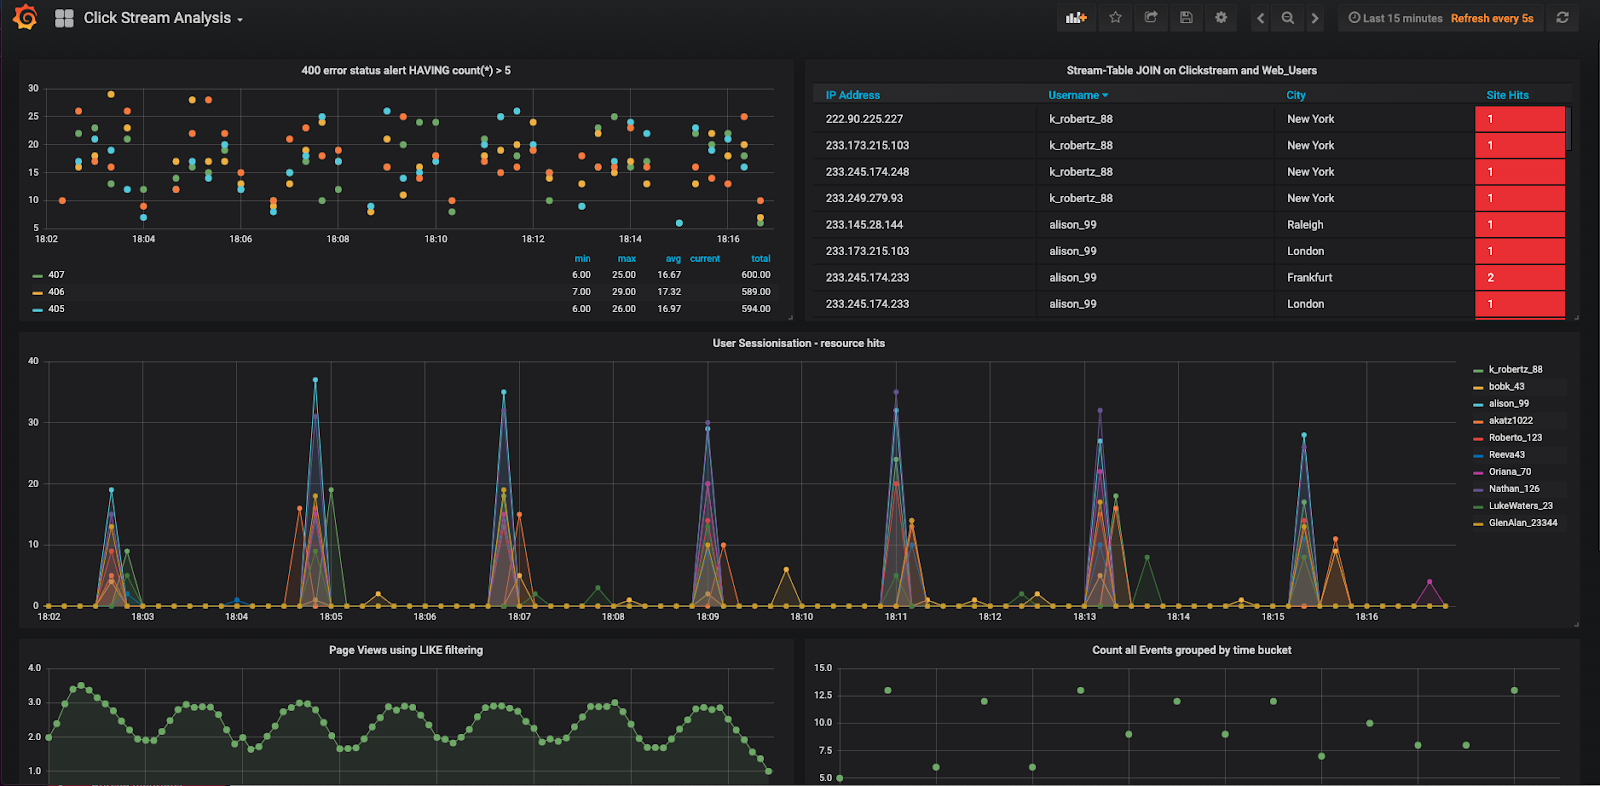
One you're in, from the left-side pane, click the tile icon: Dashboards > Manage. Now you can click your Click Stream Analysis Dashboard to enter.
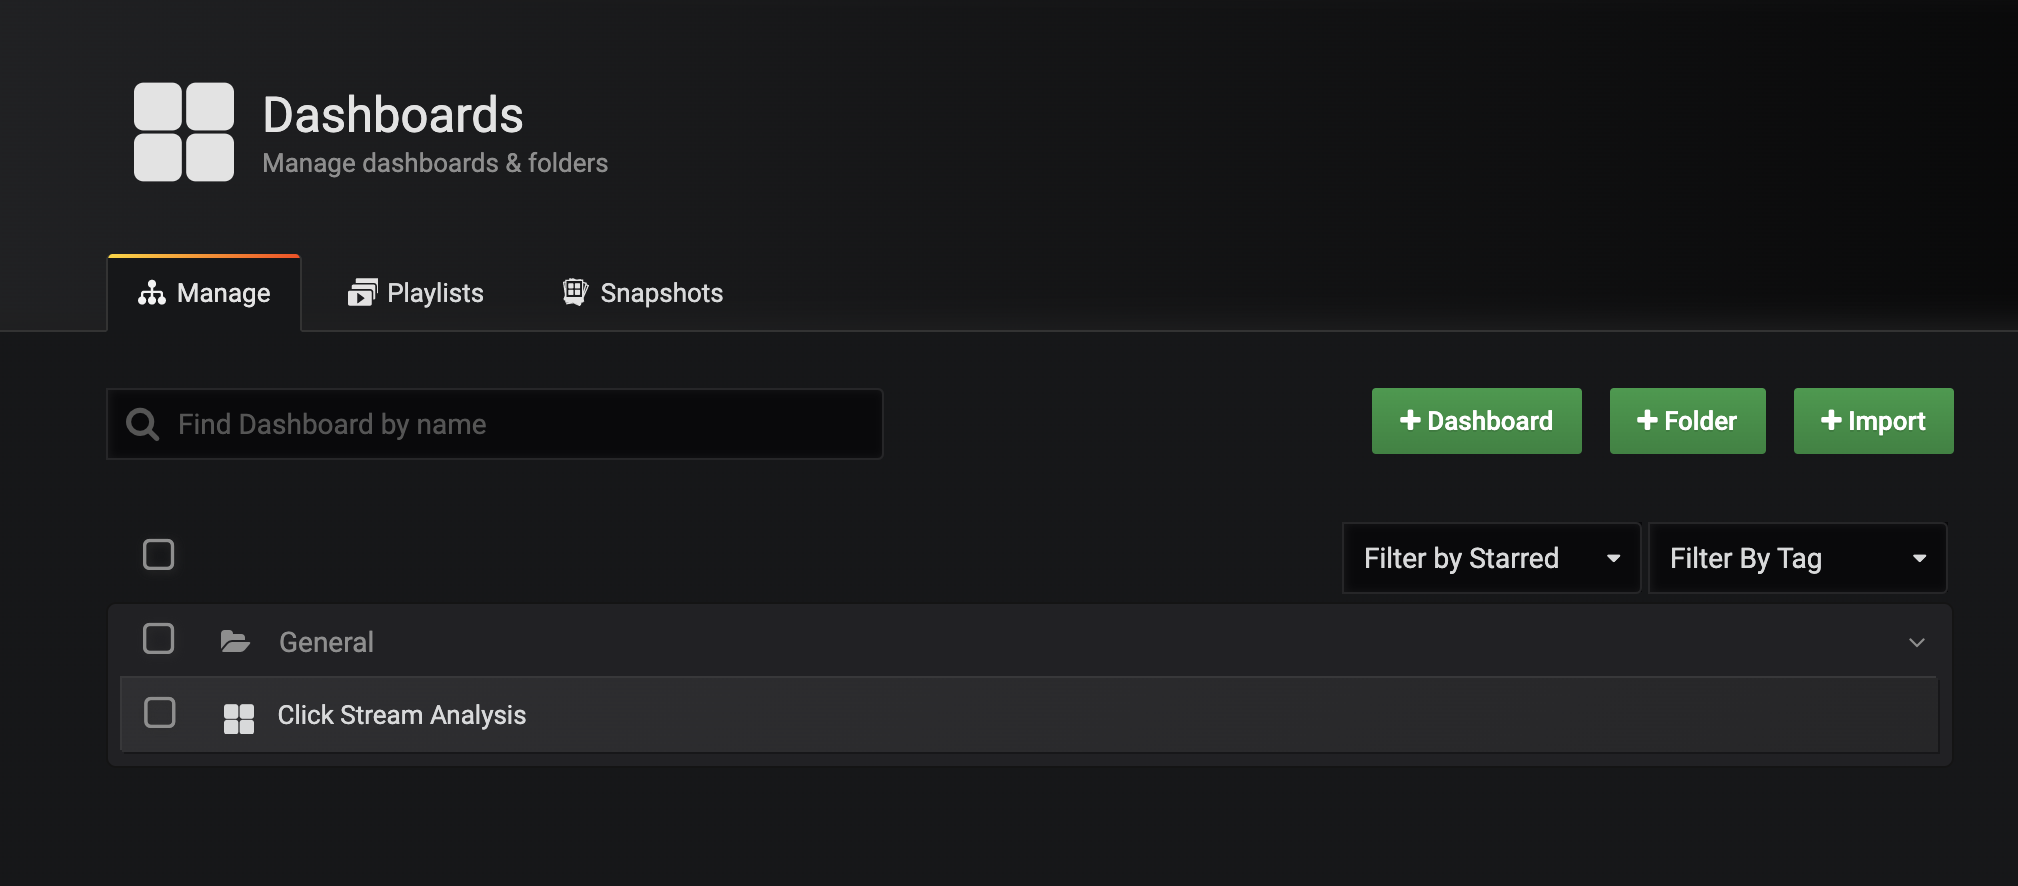
This dashboard demonstrates a series of streaming functionality where the title of each panel describes the type of stream processing required to generate the data. For example, the large chart in the middle is showing web-resource requests on a per-username basis using a Session window - where a session expires after 300 seconds of inactivity. Editing the panel allows you to view the datasource - which is named after the streams and tables captured in the statements.sql file.
-
To check the Data Sources page in Grafana, click the
Configurationgear icon on the left-side pane, and go toData Sources. Select one of your data sources and scroll to the bottom and click the Save & Test button. This will indicate whether your data source is valid. -
Once you've viewed and tested your data sources, you go back to Cloud Shell and exit out of the clickstream demo with the
CTRL+Ccommand.
Task 7. Test your understanding
Below are multiple choice questions to reinforce your understanding of this lab's concepts. Answer them to the best of your abilities.
Congratulations!
In this lab, you ran multiple Docker containers, created source connectors that generate mock clickstream data and loaded them into ksqlDB. You then sent the ksqlDB tables to Elasticsearch and Grafana, sessionized the data, and viewed the data in Grafana.
Next steps / Learn more
- Confluent on the Google Cloud Marketplace!
- More details are provided in the rest of the Kafka Streams documentation.
Google Cloud training and certification
...helps you make the most of Google Cloud technologies. Our classes include technical skills and best practices to help you get up to speed quickly and continue your learning journey. We offer fundamental to advanced level training, with on-demand, live, and virtual options to suit your busy schedule. Certifications help you validate and prove your skill and expertise in Google Cloud technologies.
Manual Last Updated April 08, 2024
Lab Last Tested April 08, 2024
Copyright 2024 Google LLC All rights reserved. Google and the Google logo are trademarks of Google LLC. All other company and product names may be trademarks of the respective companies with which they are associated.