Prüfpunkte
Deploy the application
/ 20
Create a counter metric
/ 20
Create a distribution metric
/ 20
Launch a VM to generate audit log events
/ 20
Exporting logs
/ 20
Fundamentals of Cloud Logging
GSP610

Overview
Cloud Logging is part of the Operations suite of products in Google Cloud. It includes storage for logs, a user interface called the Logs Viewer, and an API to manage logs programmatically. Use Cloud Logging to read and write log entries, search and filter your logs, export your logs, and create logs-based metrics.
In this hands-on lab, you learn how to use Cloud Logging to accumulate application logs in a single place, filter to reach the required log, understand how to create logs based metrics for advanced analysis, examine the audit logs use case, and export logs for compliance and/or advanced analysis needs.
What you'll learn
- Launch an example Google App Engine application to generate logs.
- Use Cloud Logging console to interact with the logs generated by the application.
- Create log-based Cloud Monitoring metrics.
- Use Cloud Logging to dive deep into Audit Logging.
- Create an Export of logs into BigQuery.
Setup and requirements
Before you click the Start Lab button
Read these instructions. Labs are timed and you cannot pause them. The timer, which starts when you click Start Lab, shows how long Google Cloud resources will be made available to you.
This hands-on lab lets you do the lab activities yourself in a real cloud environment, not in a simulation or demo environment. It does so by giving you new, temporary credentials that you use to sign in and access Google Cloud for the duration of the lab.
To complete this lab, you need:
- Access to a standard internet browser (Chrome browser recommended).
- Time to complete the lab---remember, once you start, you cannot pause a lab.
How to start your lab and sign in to the Google Cloud console
-
Click the Start Lab button. If you need to pay for the lab, a pop-up opens for you to select your payment method. On the left is the Lab Details panel with the following:
- The Open Google Cloud console button
- Time remaining
- The temporary credentials that you must use for this lab
- Other information, if needed, to step through this lab
-
Click Open Google Cloud console (or right-click and select Open Link in Incognito Window if you are running the Chrome browser).
The lab spins up resources, and then opens another tab that shows the Sign in page.
Tip: Arrange the tabs in separate windows, side-by-side.
Note: If you see the Choose an account dialog, click Use Another Account. -
If necessary, copy the Username below and paste it into the Sign in dialog.
{{{user_0.username | "Username"}}} You can also find the Username in the Lab Details panel.
-
Click Next.
-
Copy the Password below and paste it into the Welcome dialog.
{{{user_0.password | "Password"}}} You can also find the Password in the Lab Details panel.
-
Click Next.
Important: You must use the credentials the lab provides you. Do not use your Google Cloud account credentials. Note: Using your own Google Cloud account for this lab may incur extra charges. -
Click through the subsequent pages:
- Accept the terms and conditions.
- Do not add recovery options or two-factor authentication (because this is a temporary account).
- Do not sign up for free trials.
After a few moments, the Google Cloud console opens in this tab.

Activate Cloud Shell
Cloud Shell is a virtual machine that is loaded with development tools. It offers a persistent 5GB home directory and runs on the Google Cloud. Cloud Shell provides command-line access to your Google Cloud resources.
- Click Activate Cloud Shell
at the top of the Google Cloud console.
When you are connected, you are already authenticated, and the project is set to your Project_ID,
gcloud is the command-line tool for Google Cloud. It comes pre-installed on Cloud Shell and supports tab-completion.
- (Optional) You can list the active account name with this command:
- Click Authorize.
Output:
- (Optional) You can list the project ID with this command:
Output:
gcloud, in Google Cloud, refer to the gcloud CLI overview guide.
Set your region and zone
Certain Compute Engine resources live in regions and zones. A region is a specific geographical location where you can run your resources. Each region has one or more zones.
Run the following gcloud commands in Cloud Console to set the default region and zone for your lab:
Task 1. Viewing and searching logs
Generate logs
Generate logs to view by visiting the Google App Engine web app (bookshelf) you provisioned earlier.
- Visit the App Engine Dashboard to view the application URL.
-
In a new tab, launch the App Engine bookshelf application. You should see the link at the top right of the App Engine Dashboard.
-
If you see an Internal Server Error, this is because the Datastore Index is not yet ready. Wait a minute and reload your browser.
Expected Result:
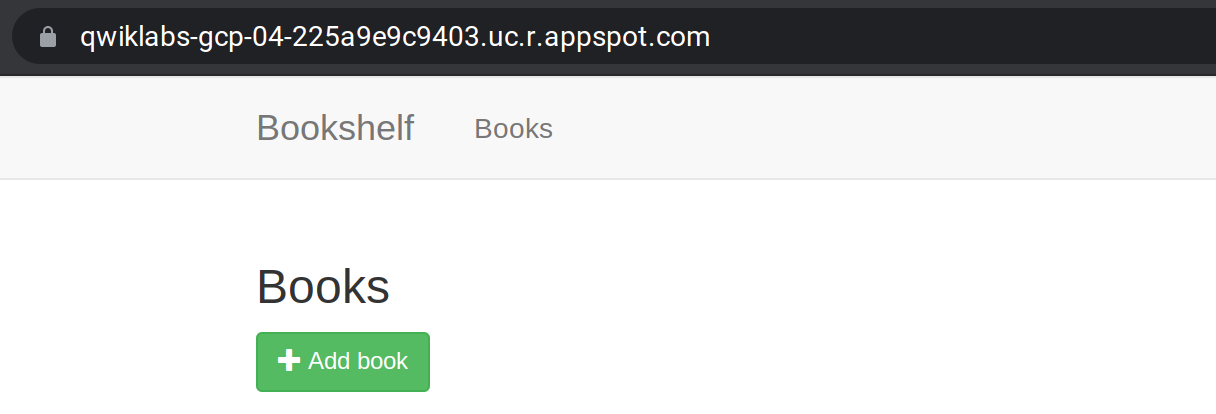
When you see the App Engine Bookshelf in your browser tab, your App Engine application is deployed and verified. Let's generate some logs!
Click Check my progress to verify the objective.
-
Refresh the browser and click Add book. Then fill out the form like the following:
-
Title:
Test Book -
Author:
Jane Doe -
Date Published:
1/2/2003 -
Description:
Log test.
-
Title:
Your form should resemble the following:
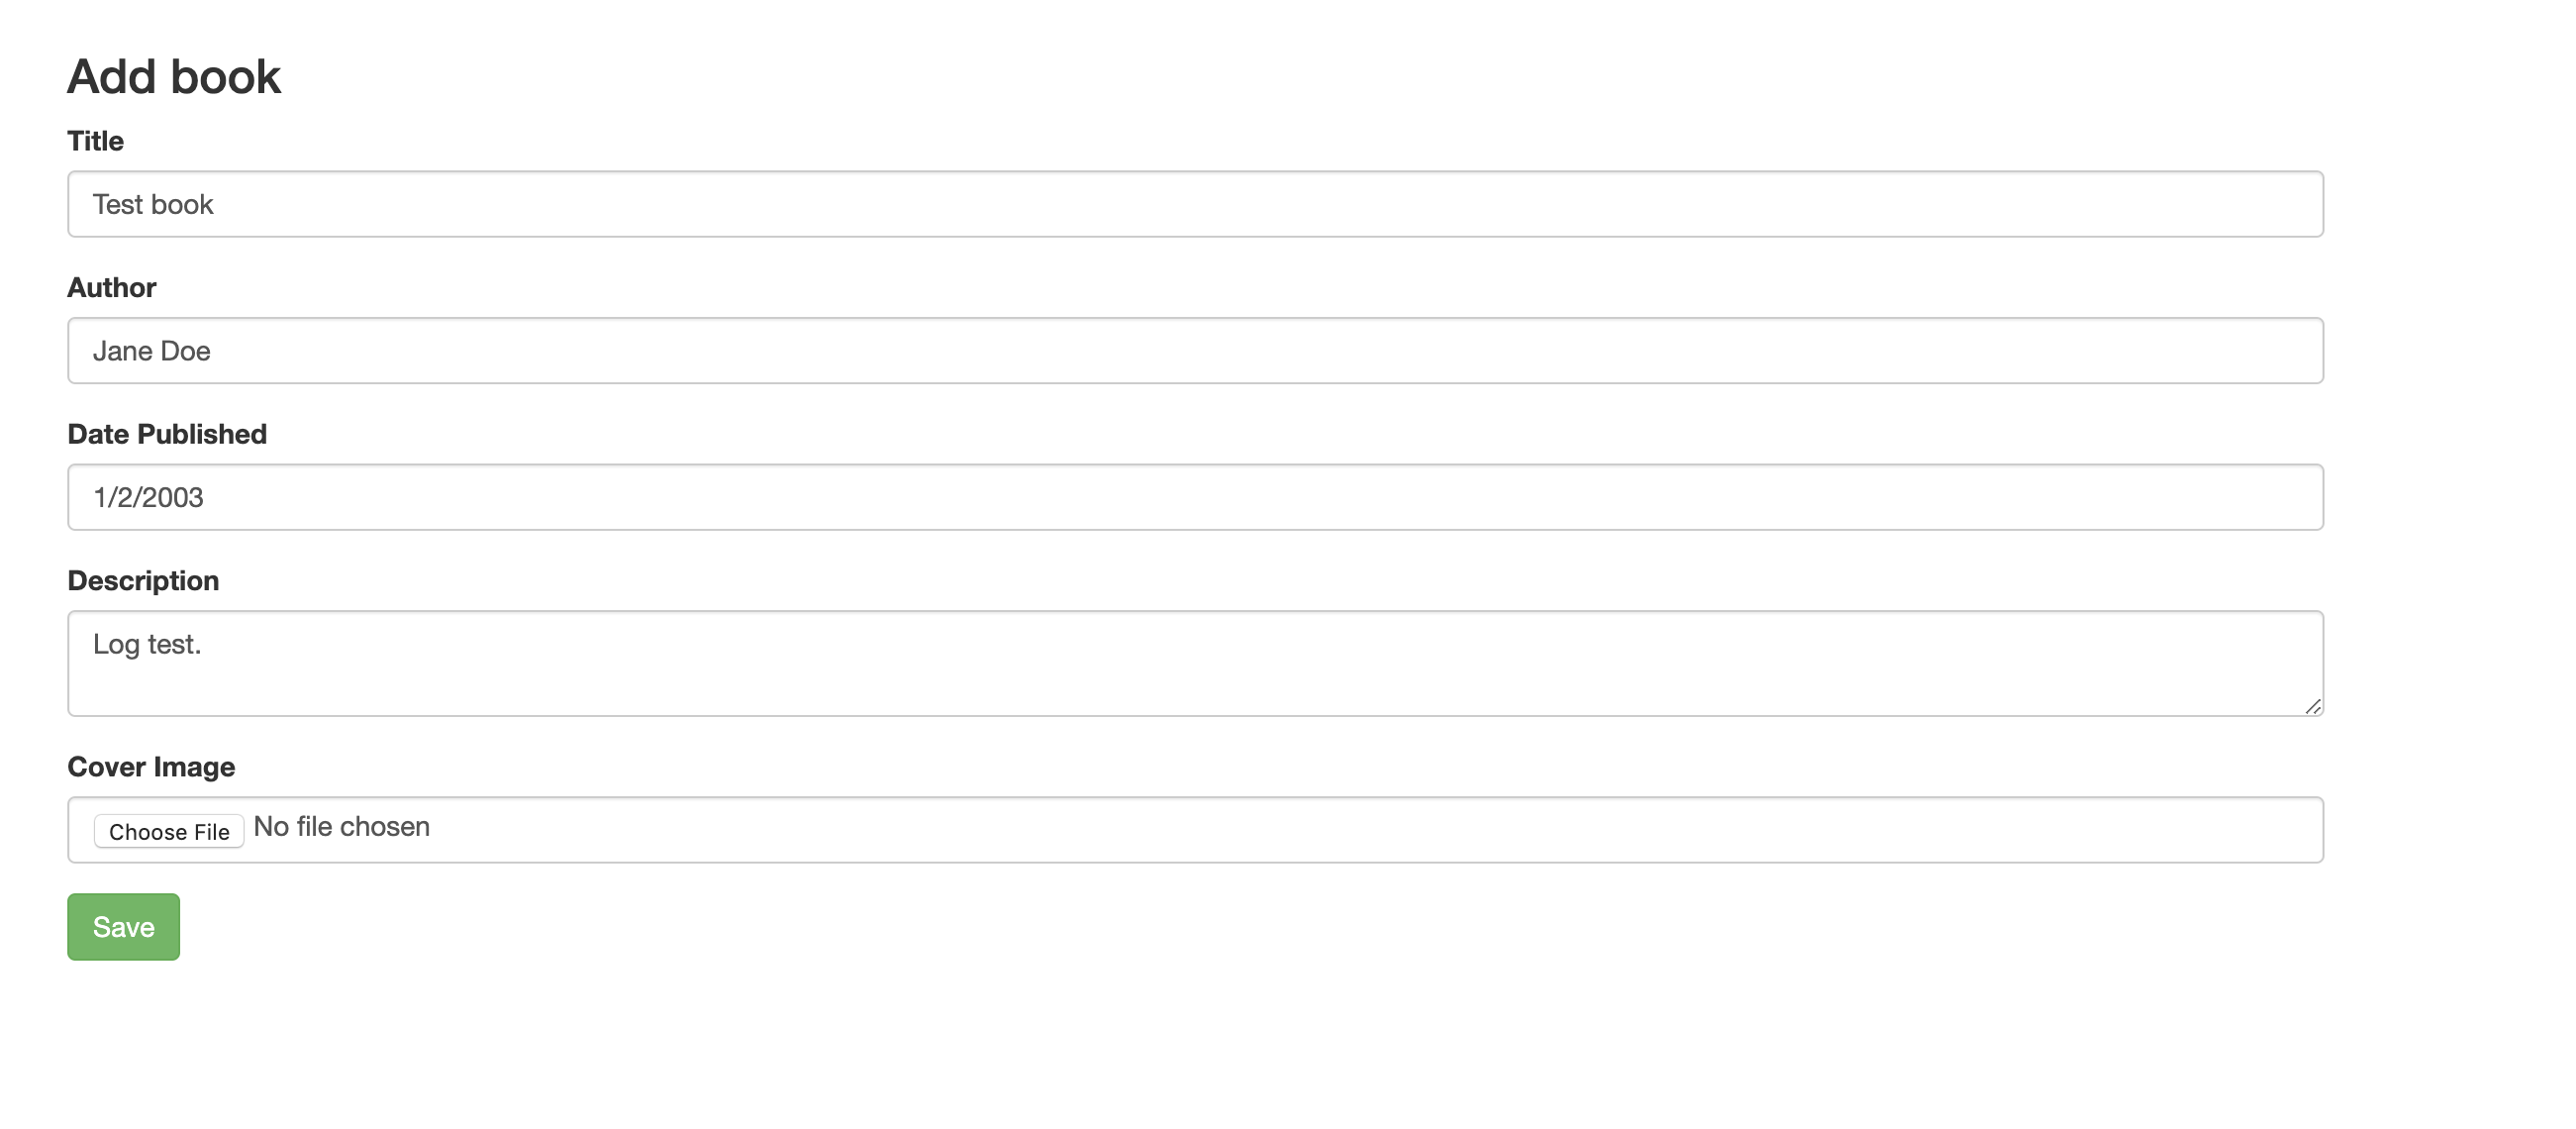
- Click Save.
Task 2. Filters
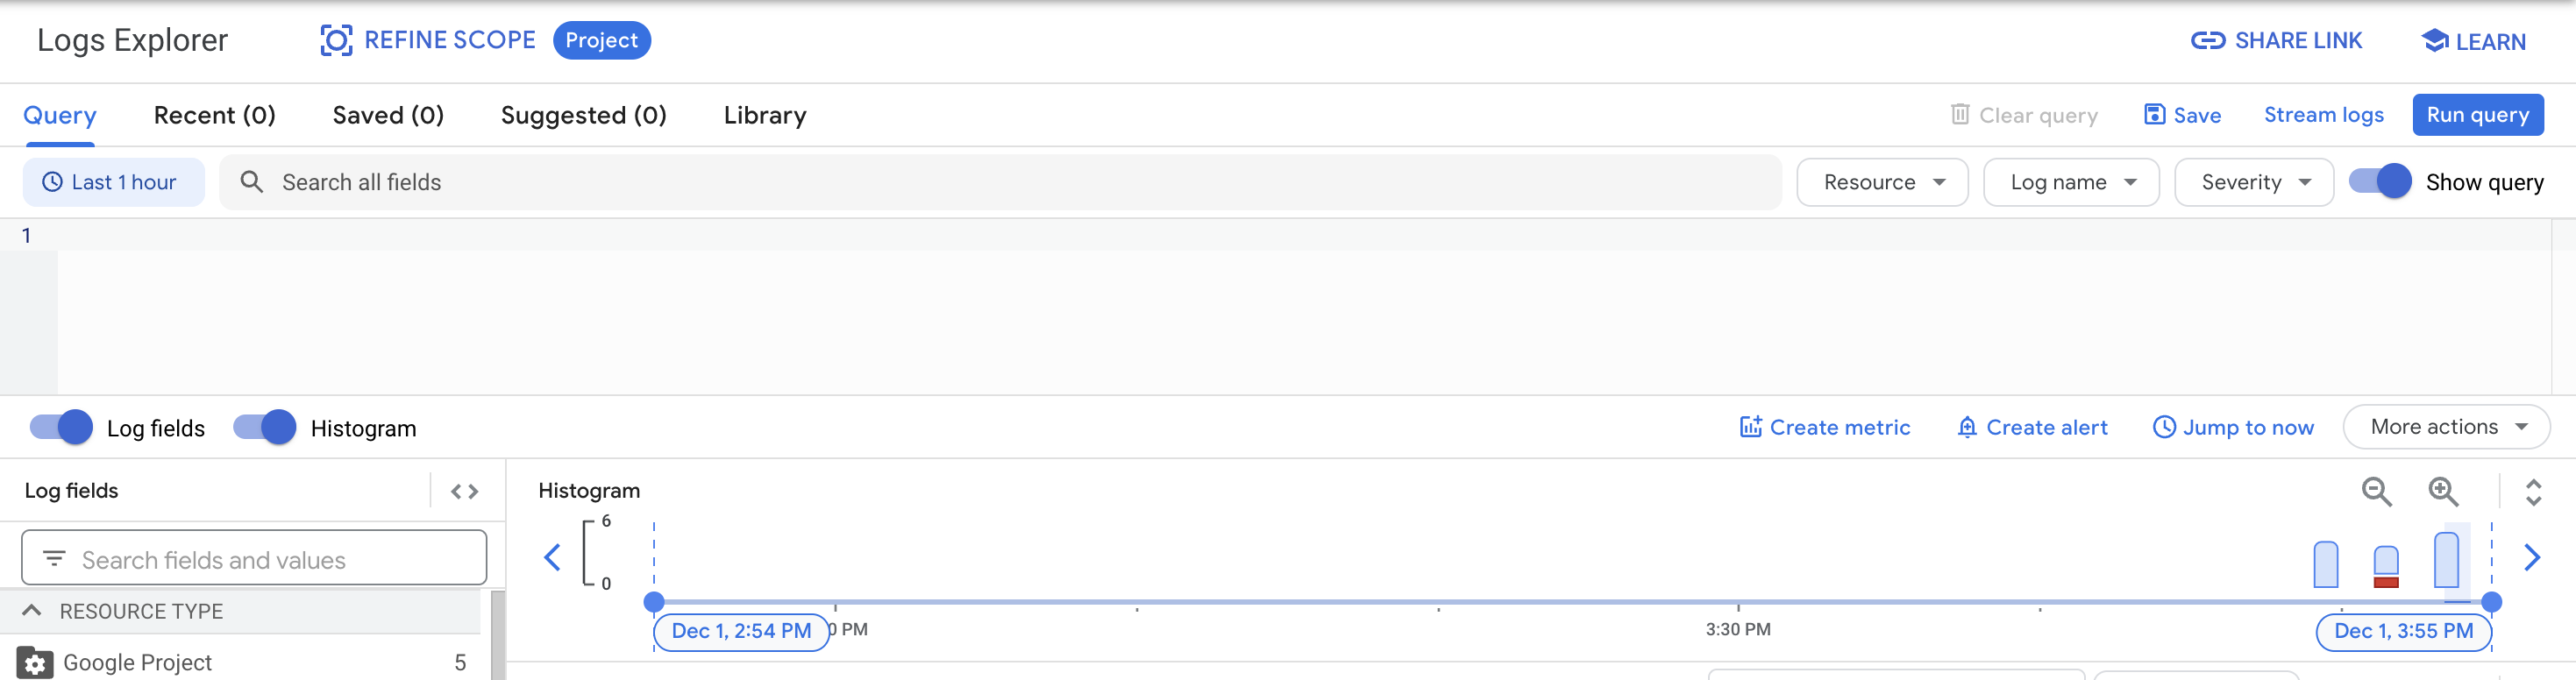
The Logs Explorer provides a variety of basic filters and advanced filters to tailor your search.
- Navigate to Navigation menu > Logging > Logs Explorer to configure which logs you view.
The Cloud Logging console has the following features:
- Resource selector: filters by resource types
- Log selector: filters to specific log types of the resources selected
- Severity selector: filters to specific log levels
- Histogram: displays the number of log entries over time
- Search Box: for text, label, or regular expression search, advanced filter
Basic filters
-
From the Logs Explorer, enable the show query button.
-
In the first (Resource) dropdown, select GAE Application > default > All version_id as the service for which you want to view the logs. Click Apply. This displays all the logs for your bookshelf app.
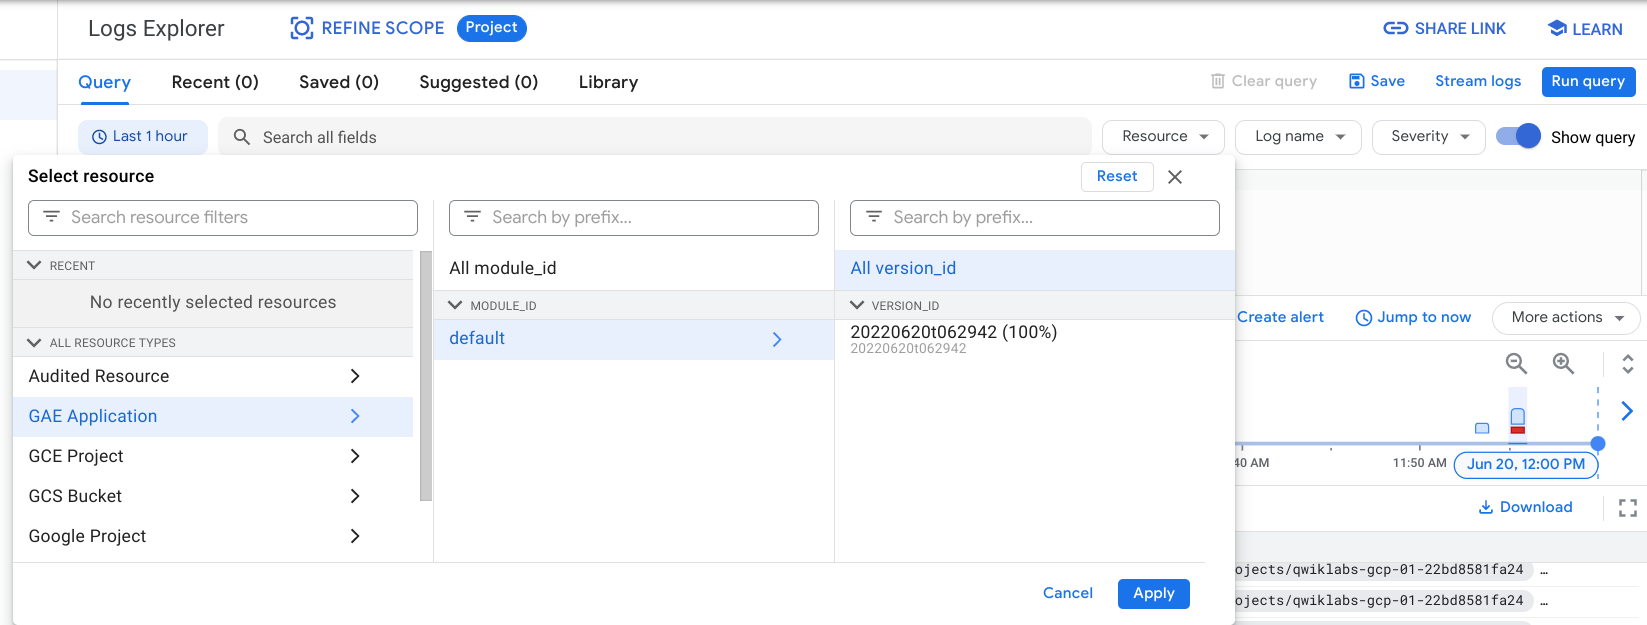
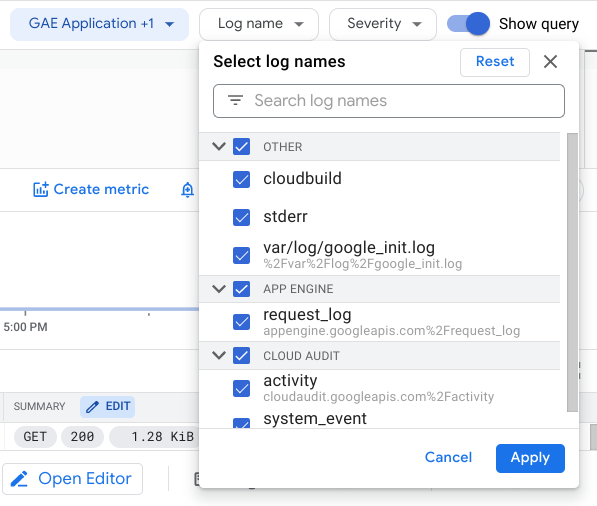
- In the next (Log name) dropdown, select all the log names and click Apply.
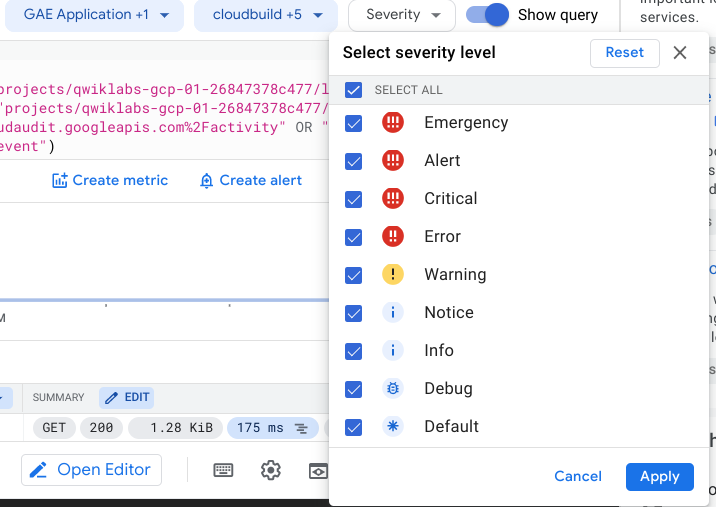
- In the next (Severity) dropdown, click Select multiple, then select all the checkboxes and click Apply.
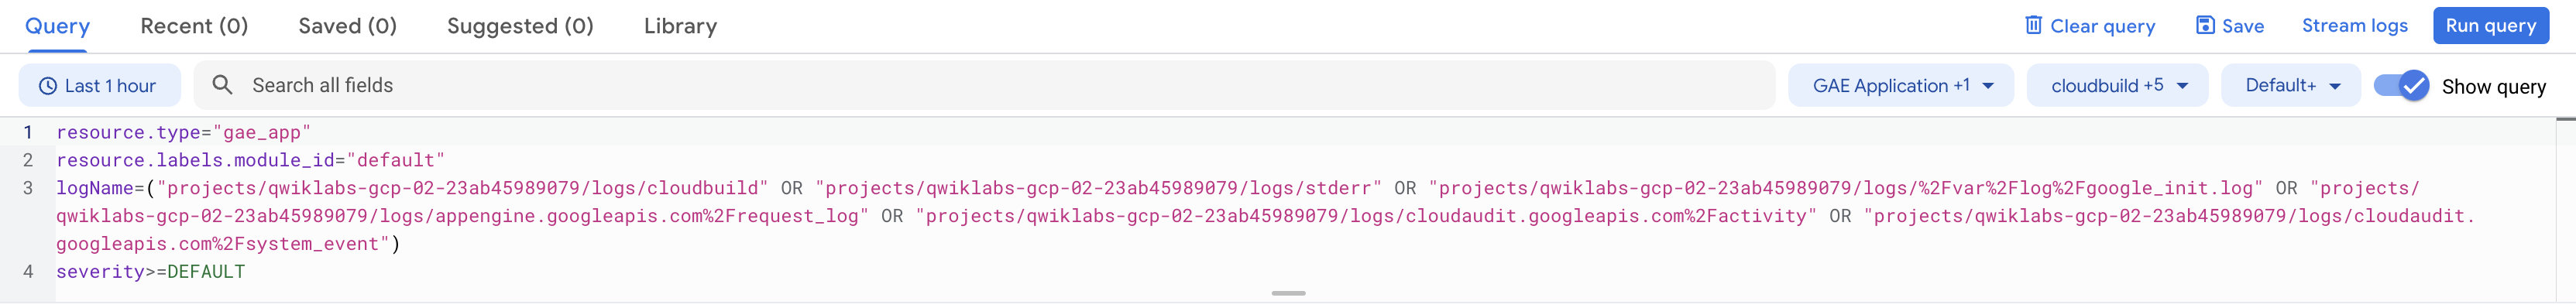
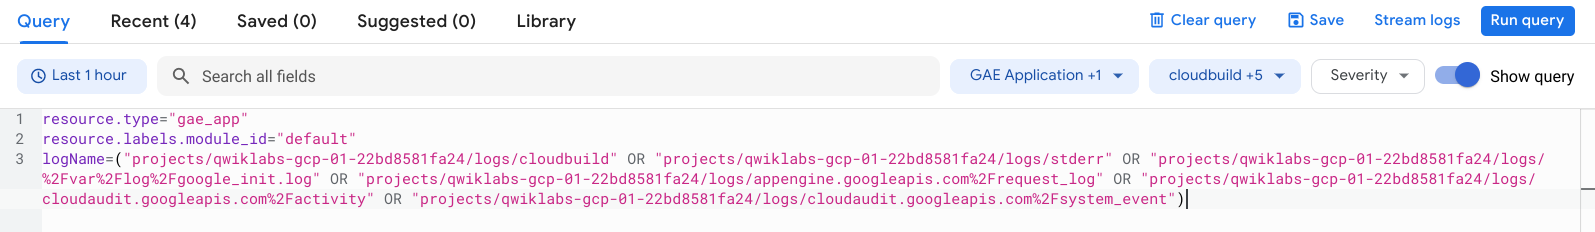
- Your Query builder should look like this:
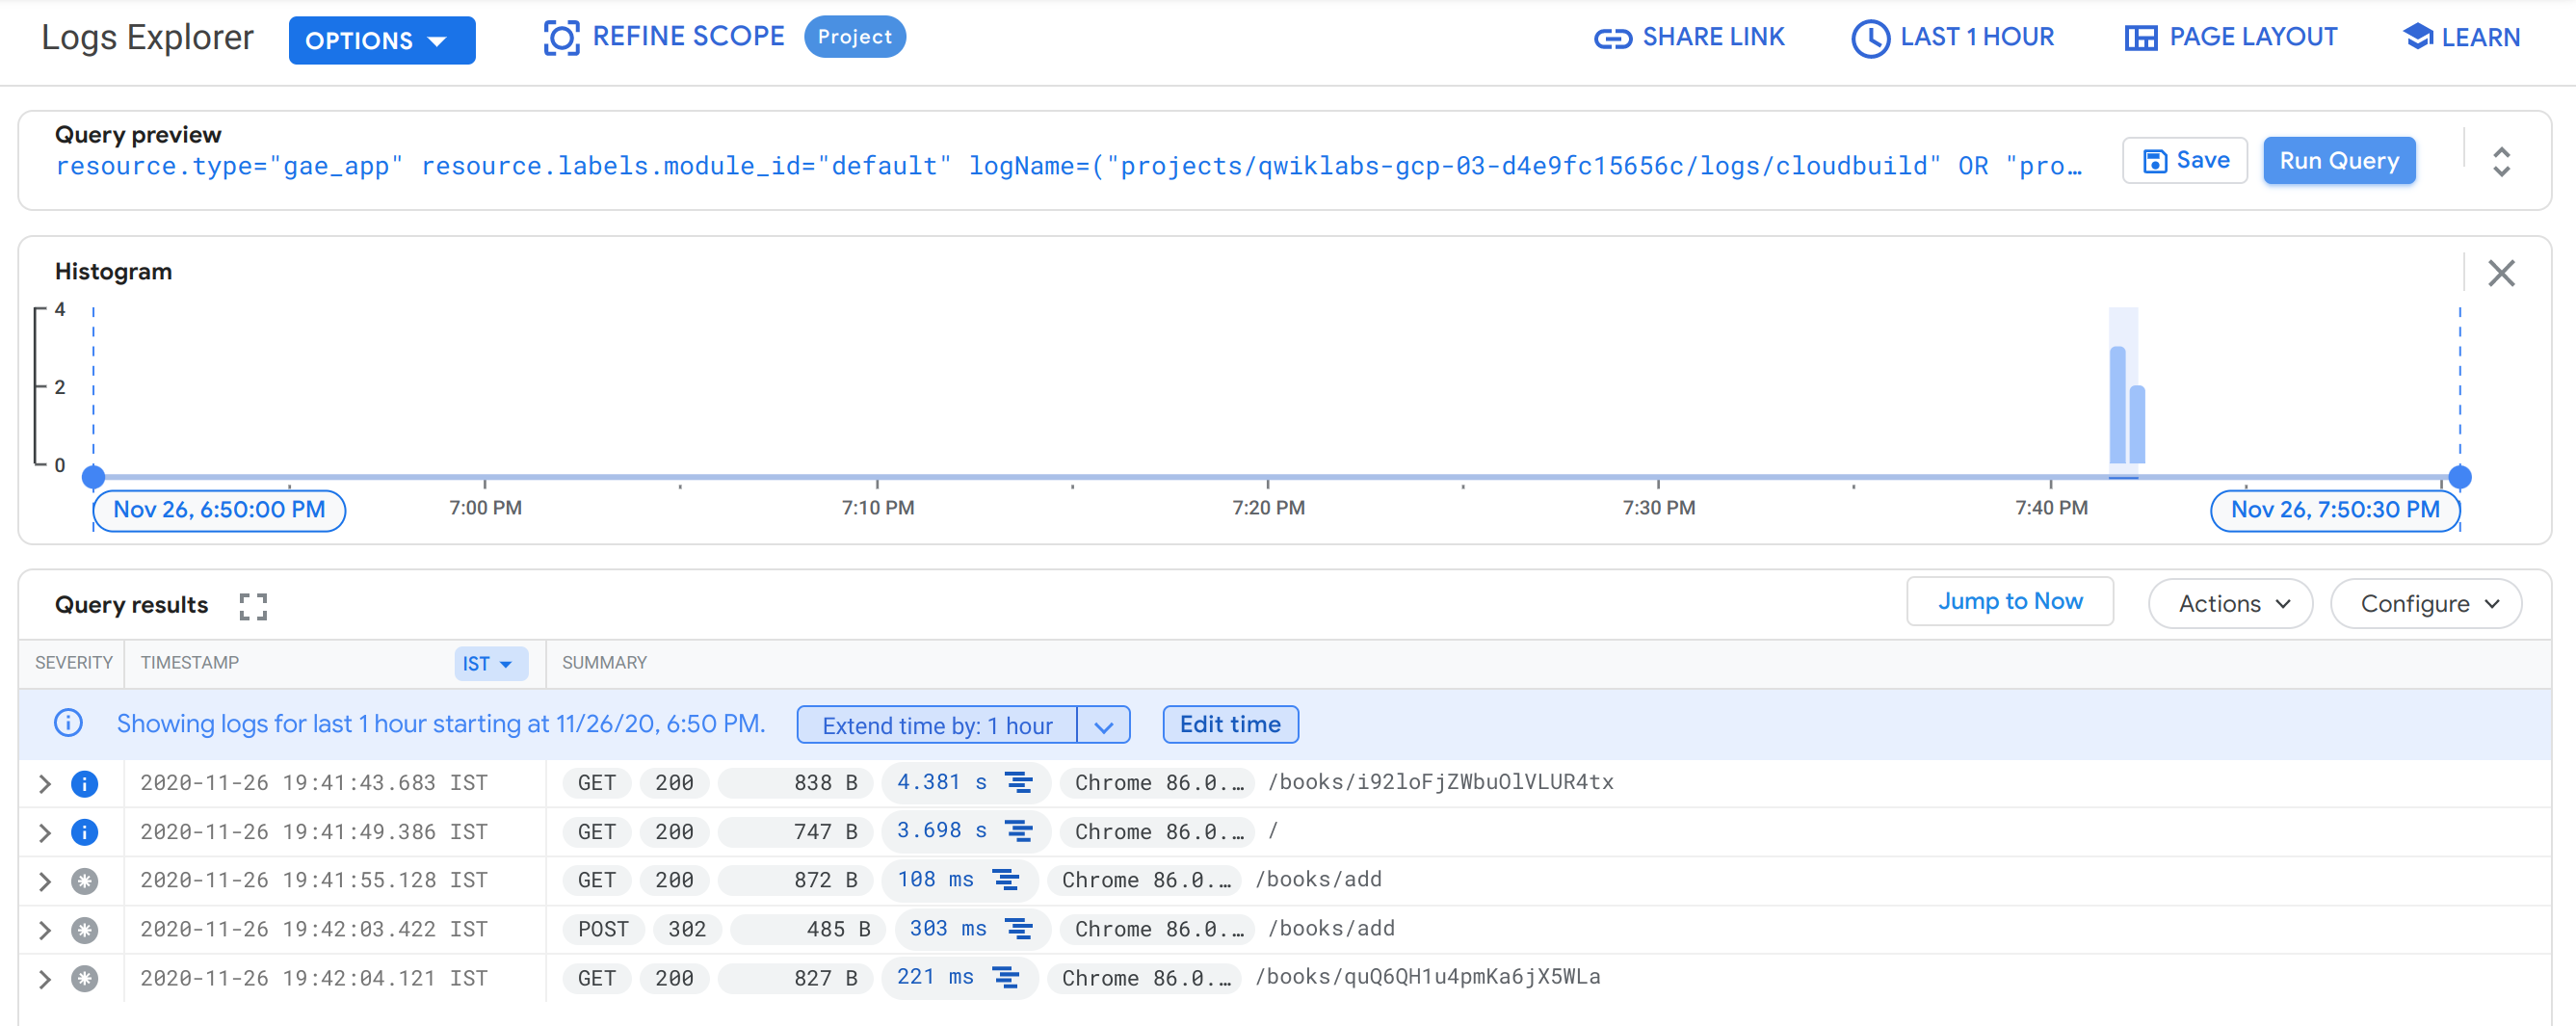
- Click Run Query button in the top right of the Query builder.
Advanced filters
- In the Query builder text area, add the following new line:
This line displays all GAE app logs with latency of greater than or equal to 0.01seconds.
- Click Run Query and review the updated list of log entries, which show page loads longer than 0.01s.
- Remove the filters by clearing all the text from the Query builder text area and click Run Query.
Task 3. Log based metrics
Log-based metrics are Cloud Monitoring metrics based on the content of log entries. Therefore, your logs don't just sit around and wait for someone to notice problems; Cloud Monitoring automatically monitors the logs for events and information you define in monitoring metrics. Log-based metrics are also a great way to achieve monitoring of your custom applications. If your application can write logs to a VM's filesystem, you can build monitoring on top of them!
Cloud Logging provides two kinds of user-defined logs-based metrics - Counter and Distribution.
Counter metrics
Counter metrics count the number of log entries matching an advanced logs filter. For example, a metric that counts log entries representing certain types of errors from specific resources. Want to be alerted if a lot of your website visitors are receiving HTTP 500 errors? Counter metrics can help.
Distribution metrics
Distribution metrics accumulate numeric data from log entries matching a filter, and perform mathematical calculations against them. A common use for distribution metrics is to track latency patterns/trends over time. As each log entry is received, a latency value is extracted from the log entry and added to the distribution. At regular intervals, the accumulated distribution is written to Cloud Monitoring.
Task 4. Create a counter metric
In this section, you create a counter metric to count the number of successful website hits, in this case, all logs with HTTP response status = 200.
-
Still in Logs Explorer, click Clear Query to clear the Query builder.
-
In the Resource selector dropdown, select GAE Application > default > All version_id and click Apply.
-
In the Log name selector dropdown, select all the log names and click Apply.
Your Query builder should look like this:
- Click Run Query button. In the Query results, click the status "200" (in any row that has 200) and select Show matching entries:
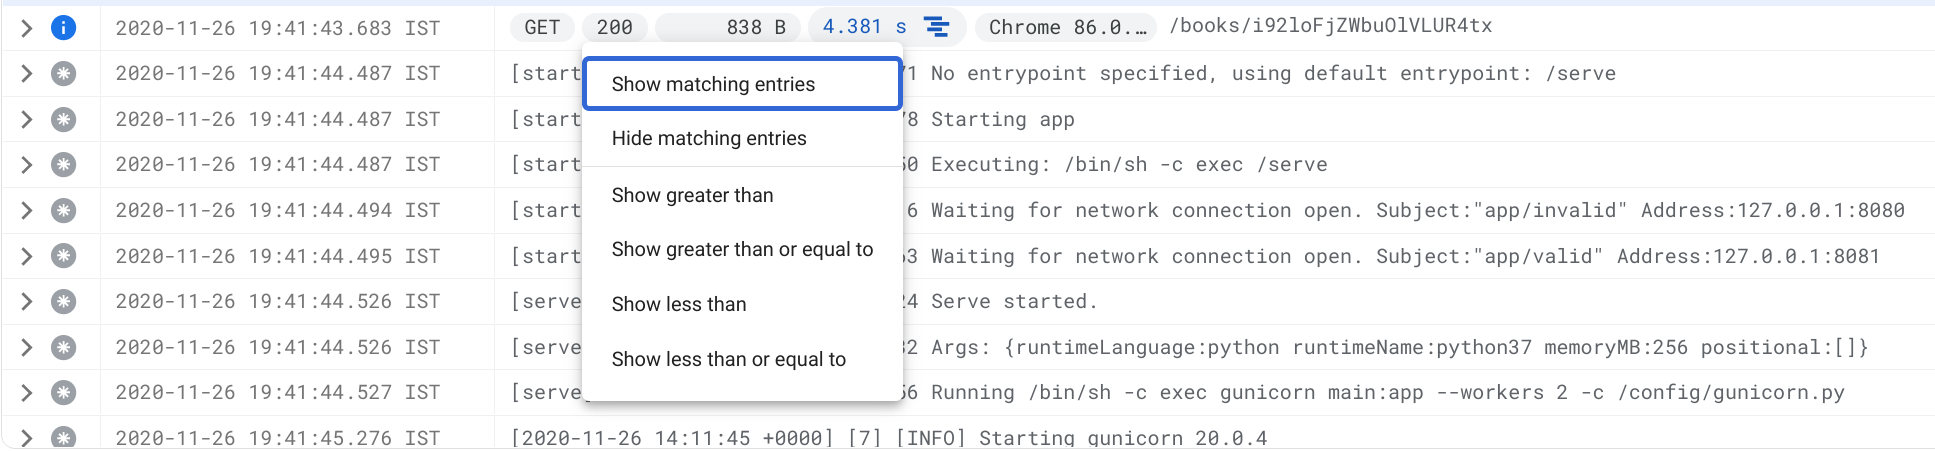
You'll see:
- The list displays only the logs with a 200 status.
- In the Query build text area, notice that a filter is automatically created with the condition (protoPayload.status=200 OR httpRequest.status=200).
Create a monitoring metric based on your filter
- Click Create Metric to create a monitoring metric based on this filter.
- In the Metric Editor, set Metric Type as Counter.
- Under the Details section, set the Log metric name to
200responses. Leave all the other fields at their default. - Click CREATE METRIC.
Click Check my progress to verify the objective.
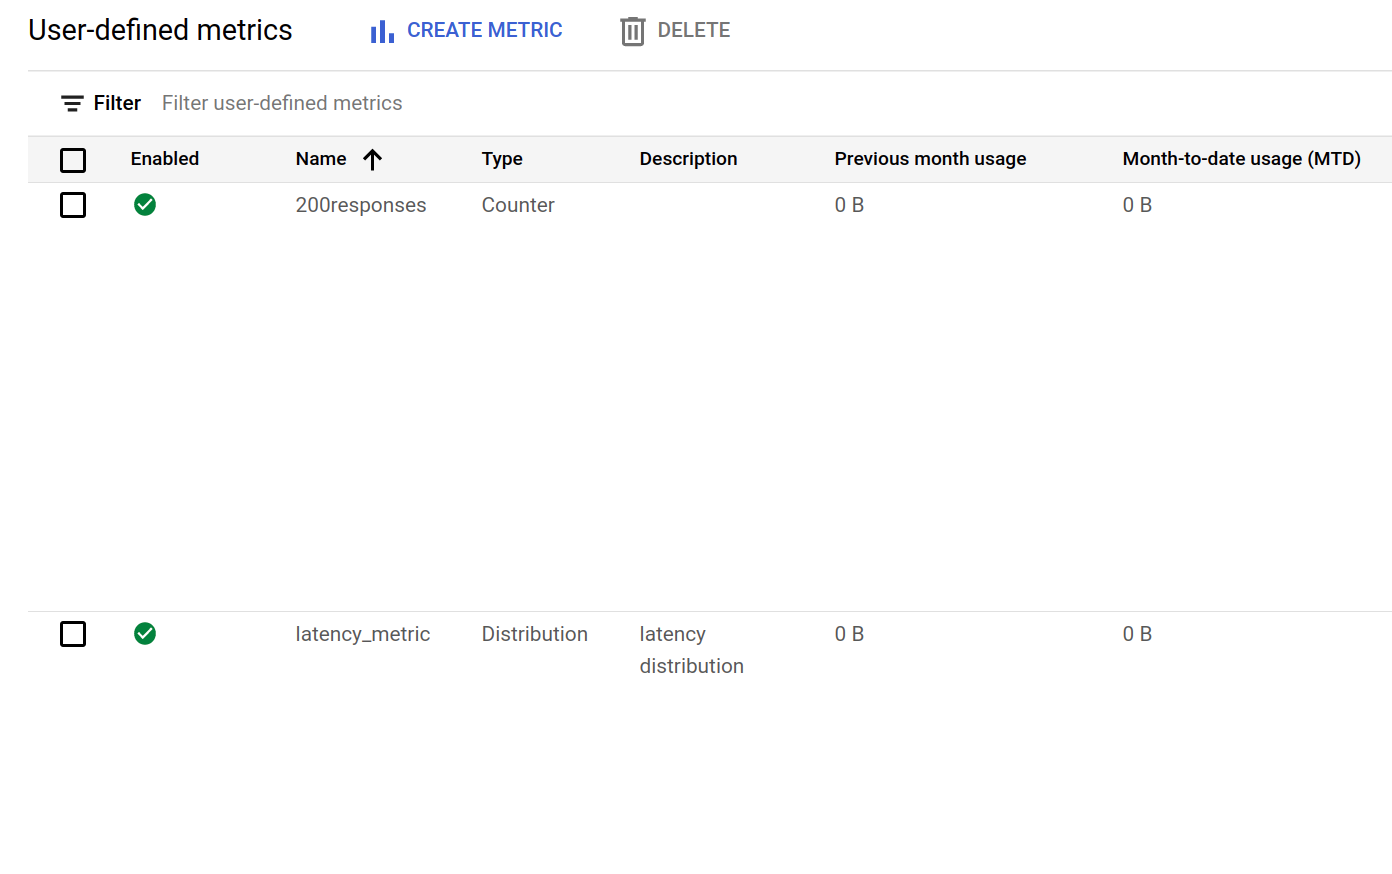
-
Click Logs-based metrics and list your new metric under User-defined Metrics section.
-
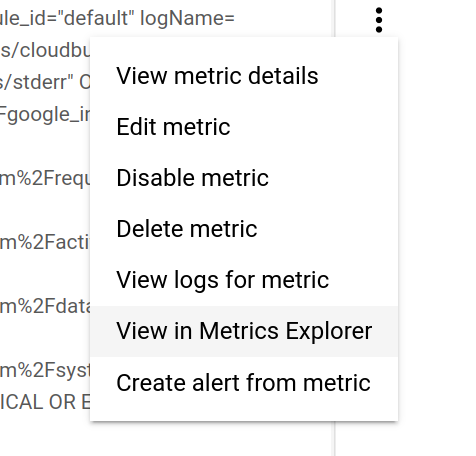
View metric details by clicking the three dots on the new metric line > View in Metrics Explorer.
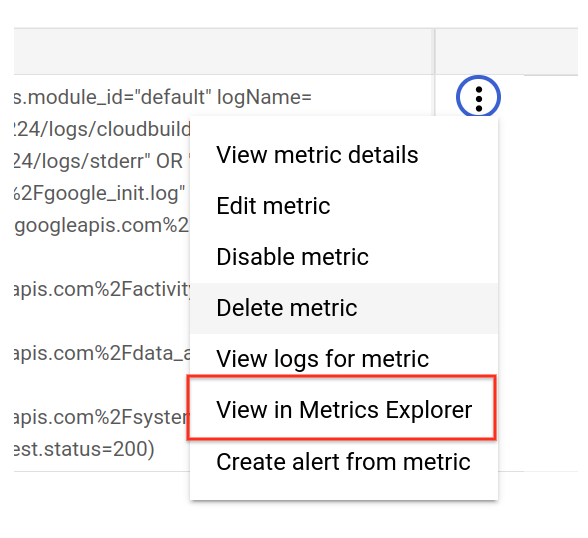
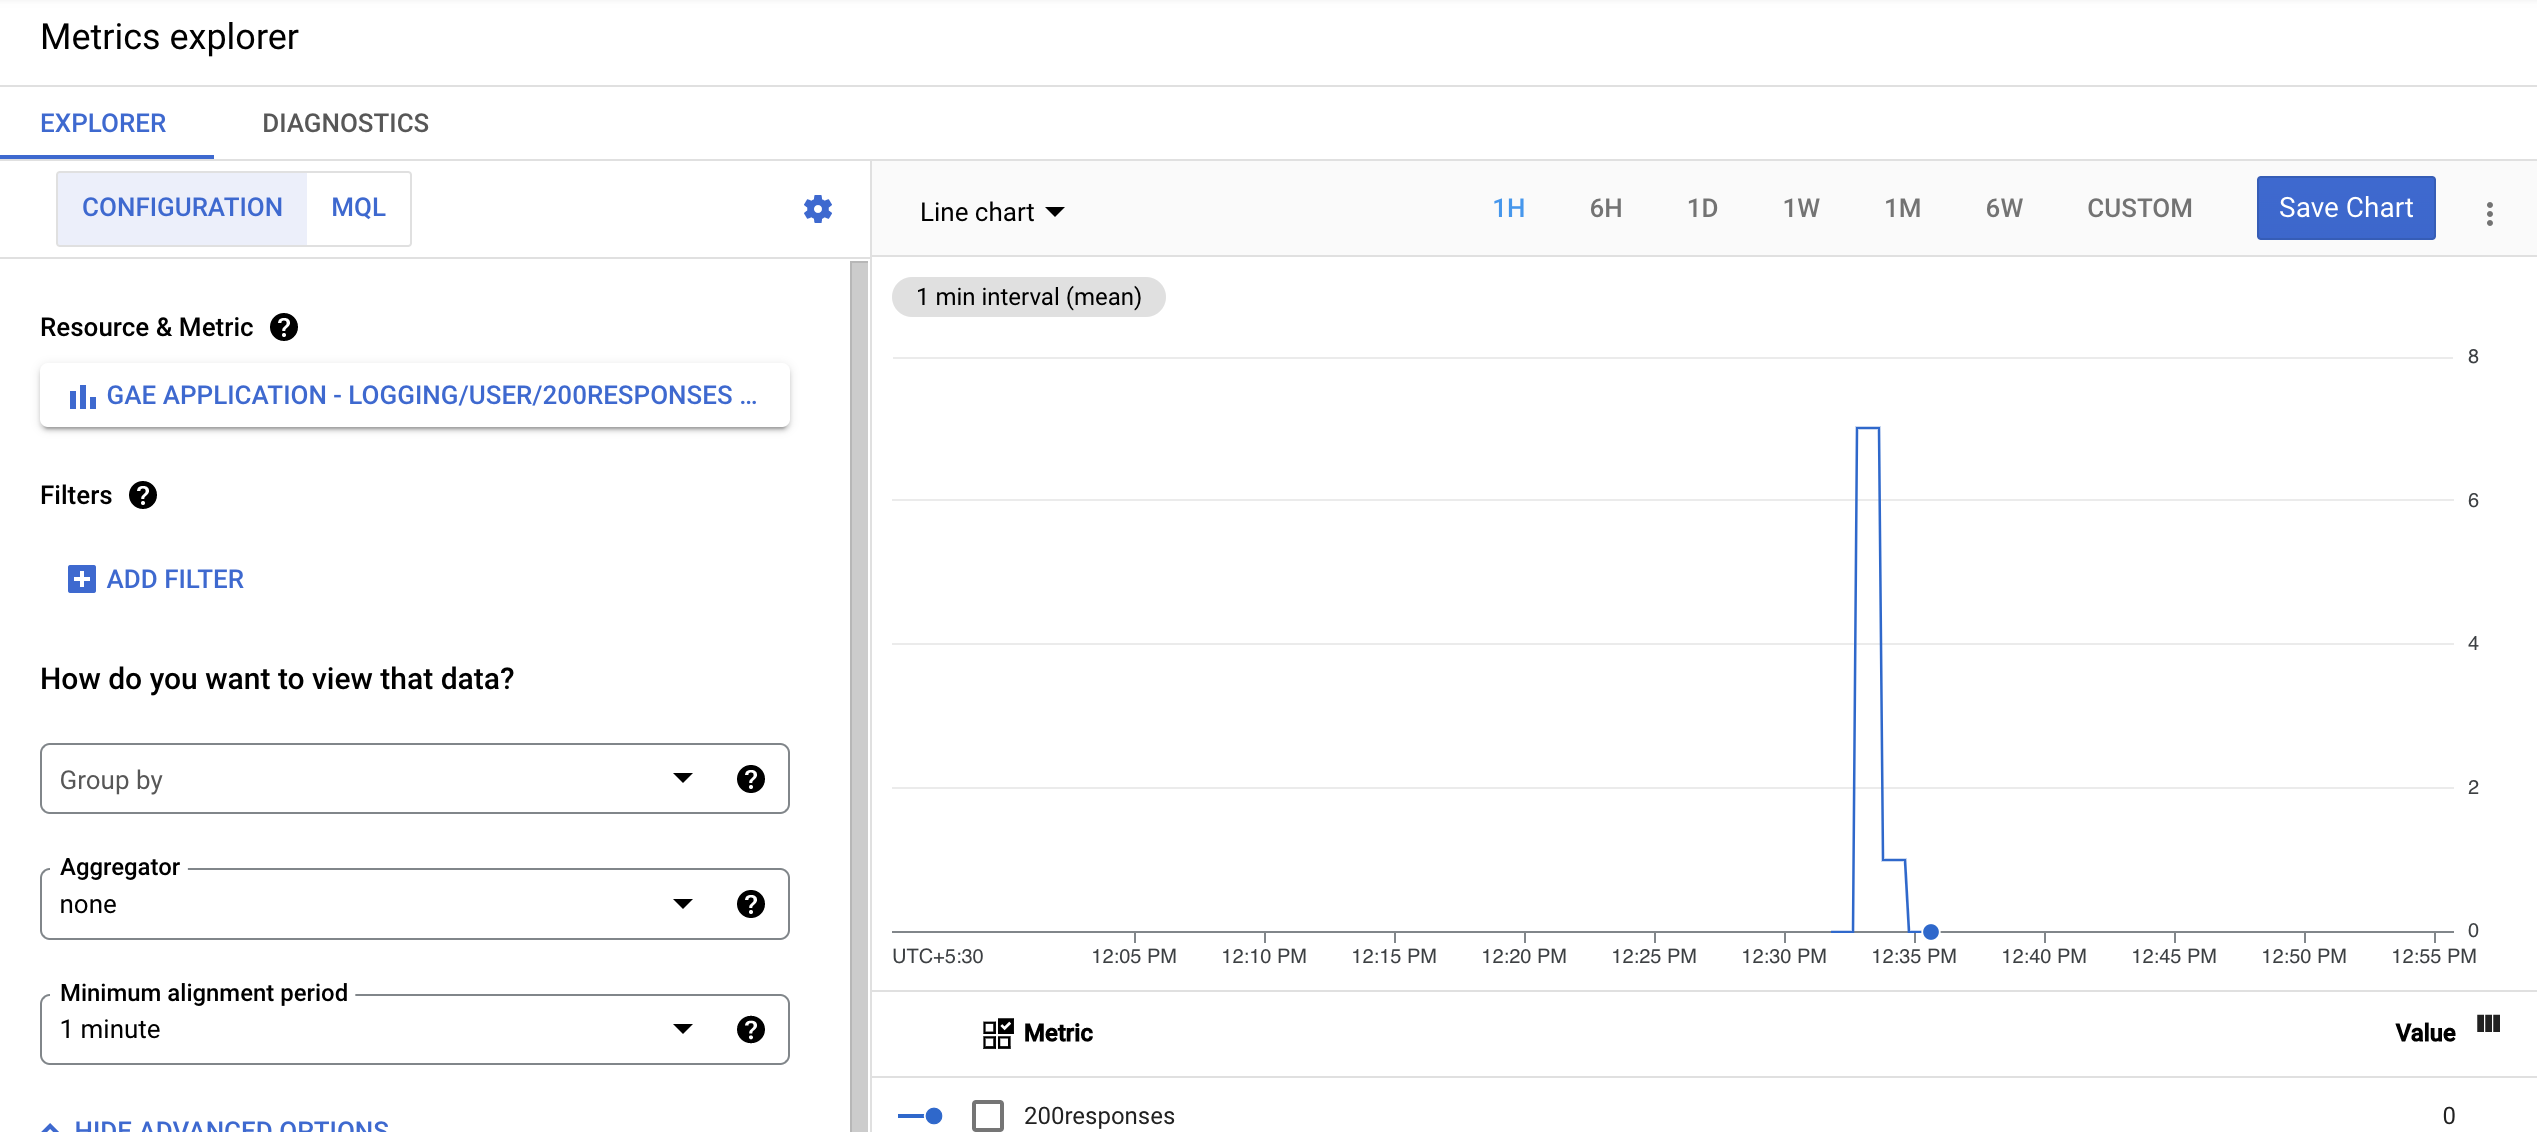
This opens Cloud Monitoring, wait for your Cloud Monitoring workspace to build.
When the Cloud Monitoring window opens, your workspace is ready. This metric is ready to monitor and analyze your application's behavior:
-
Save your chart to a Dashboard to easily check during the lab.
- Click Save Chart in the upper right.
- Select New Dashboard under Dashboard.
- Name your Dashboard.
- Click Save.
-
Click View Dashboard to view the dashboard.
Task 5. Create a distribution metric
In this section, you create a distribution counter to monitor bookshelf application latency.
-
Return to the Cloud Logs Explorer (Navigation menu > Logging > Logs Explorer). Create a filter to select GAE Application > default > All version_id, All Logs, and All Severity in the Query builder as shown below and click Run query.
-
Click Create Metric.
-
In the Metric Editor panel, set the following fields to the values below:
|
Field |
Value |
|
Metric Type |
Distribution |
|
Log-based metric name |
latency_metric |
|
Description |
latency distribution |
|
Field name |
protoPayload.latency |
- Click Create Metric.
Click Check my progress to verify the objective.
- Verify the latency metric is created in Logs-based metrics:
-
Generate more logs. Refresh the bookshelf application multiple times and add another book. Give the metric a minute or two to catch up and accumulate the data points.
-
Click View in Metrics Explorer by selecting the option in the vertical ellipsis menu against the metric:
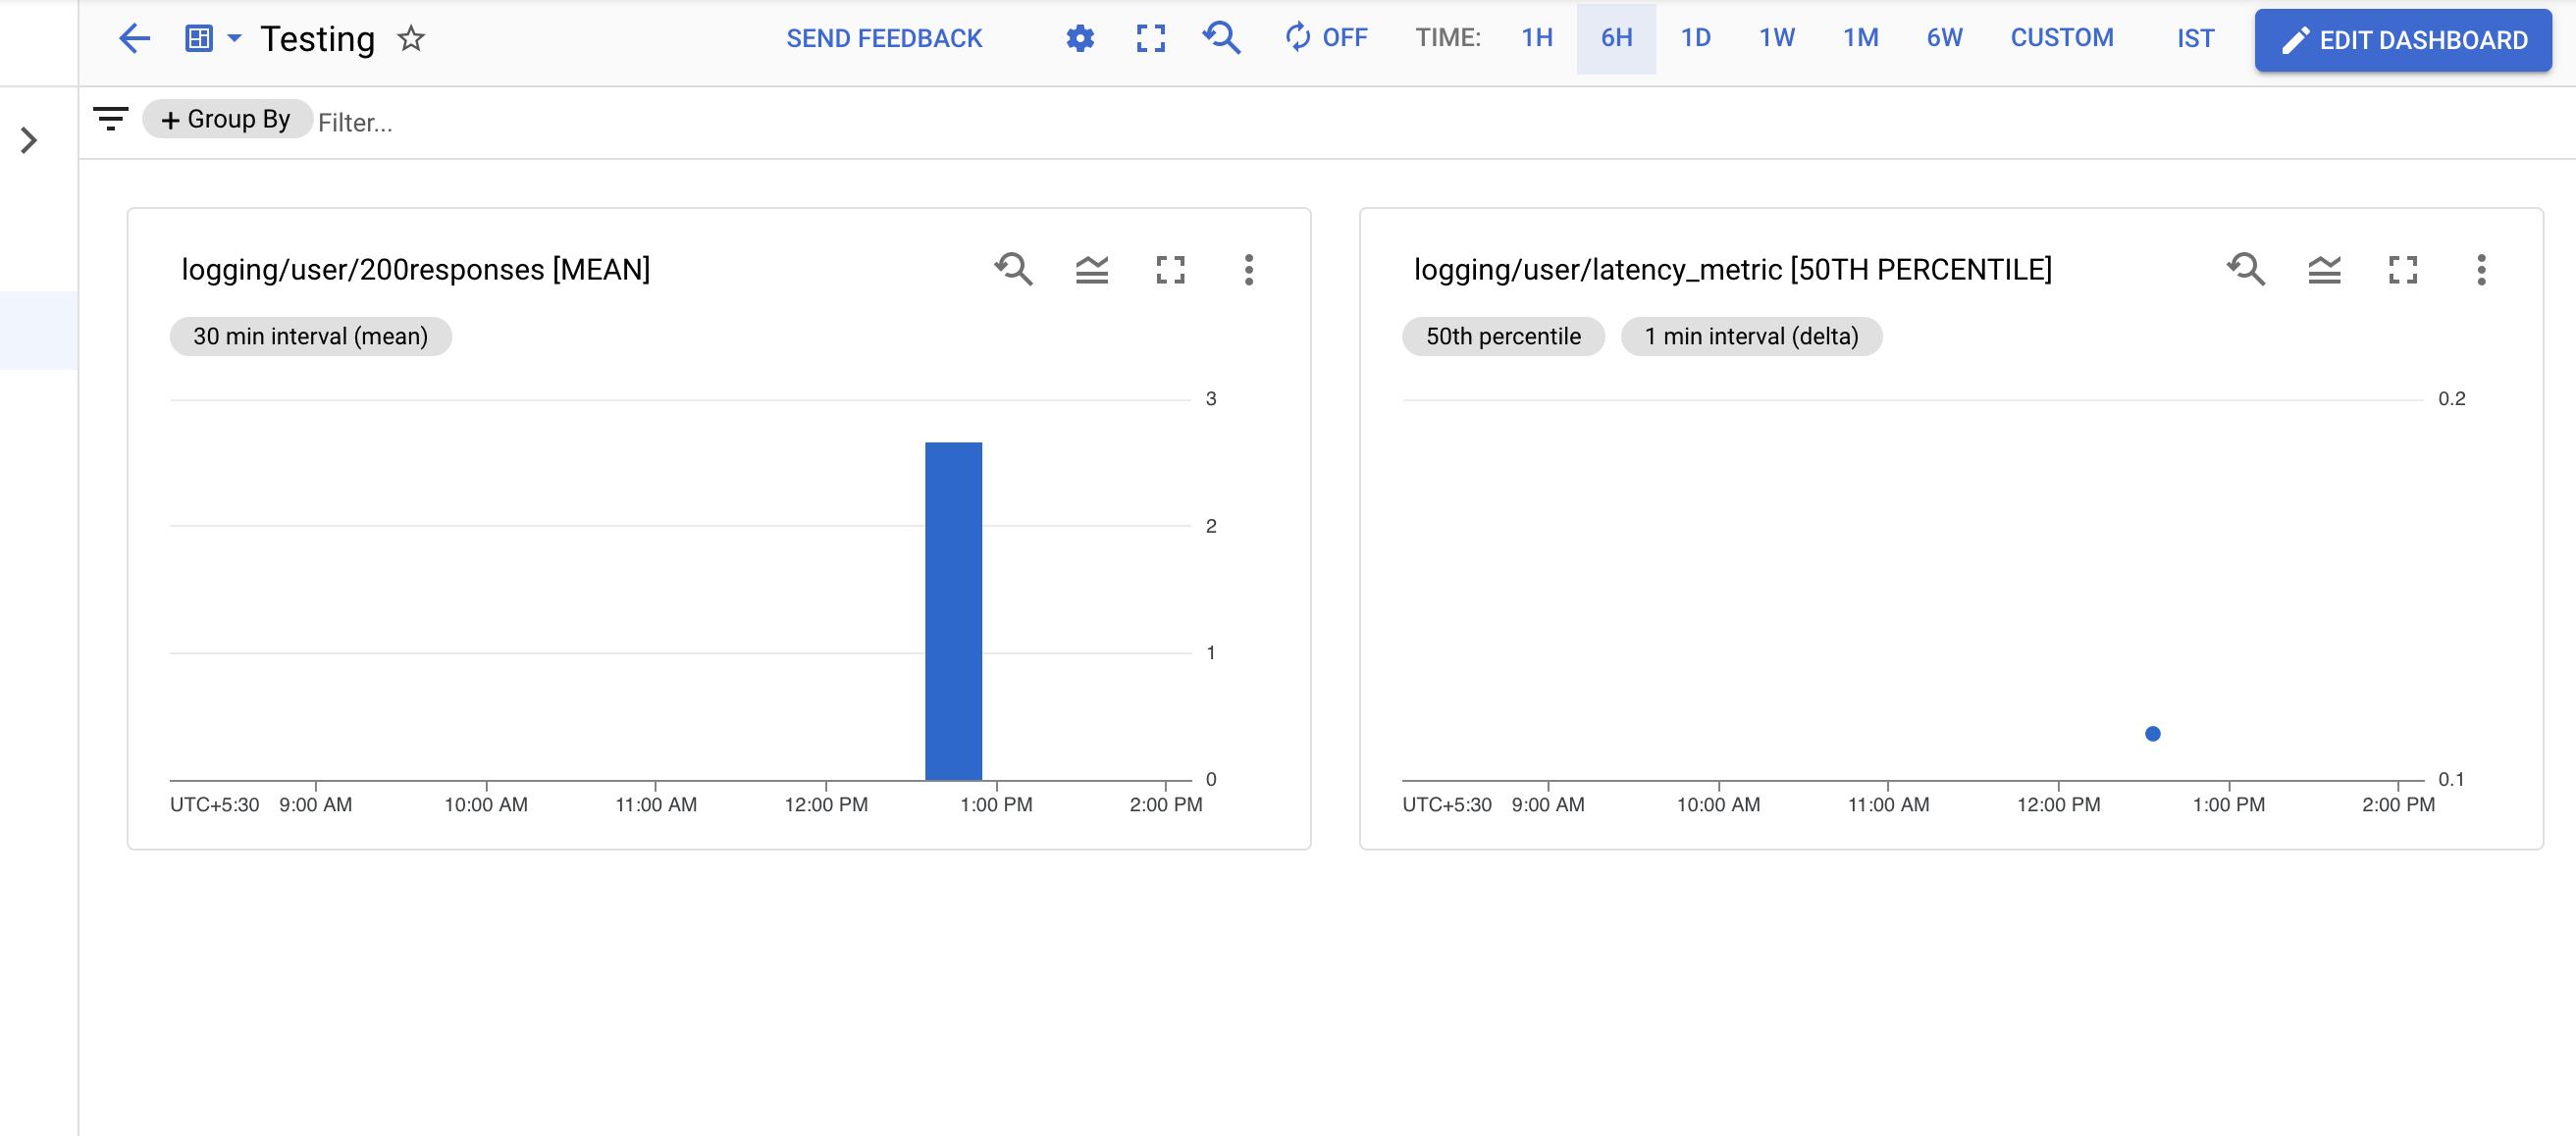
- Optional: Save this chart to your Dashboard and/or check out the Dashboard to see if the chart you previously saved shows data for 200 responses.
Task 6. View log metrics in the Cloud Monitoring Console
The Cloud Monitoring Overview window provides a monitoring resource overview.
- From the left menu, select Dashboards. Click your previously created Dashboard.
Cloud Monitoring displays the chart data in one of four formats: Line, Stacked Bar, Stacked Area or Heatmap. To specify the format:
- Click +ADD WIDGET and select a format Stacked Area.
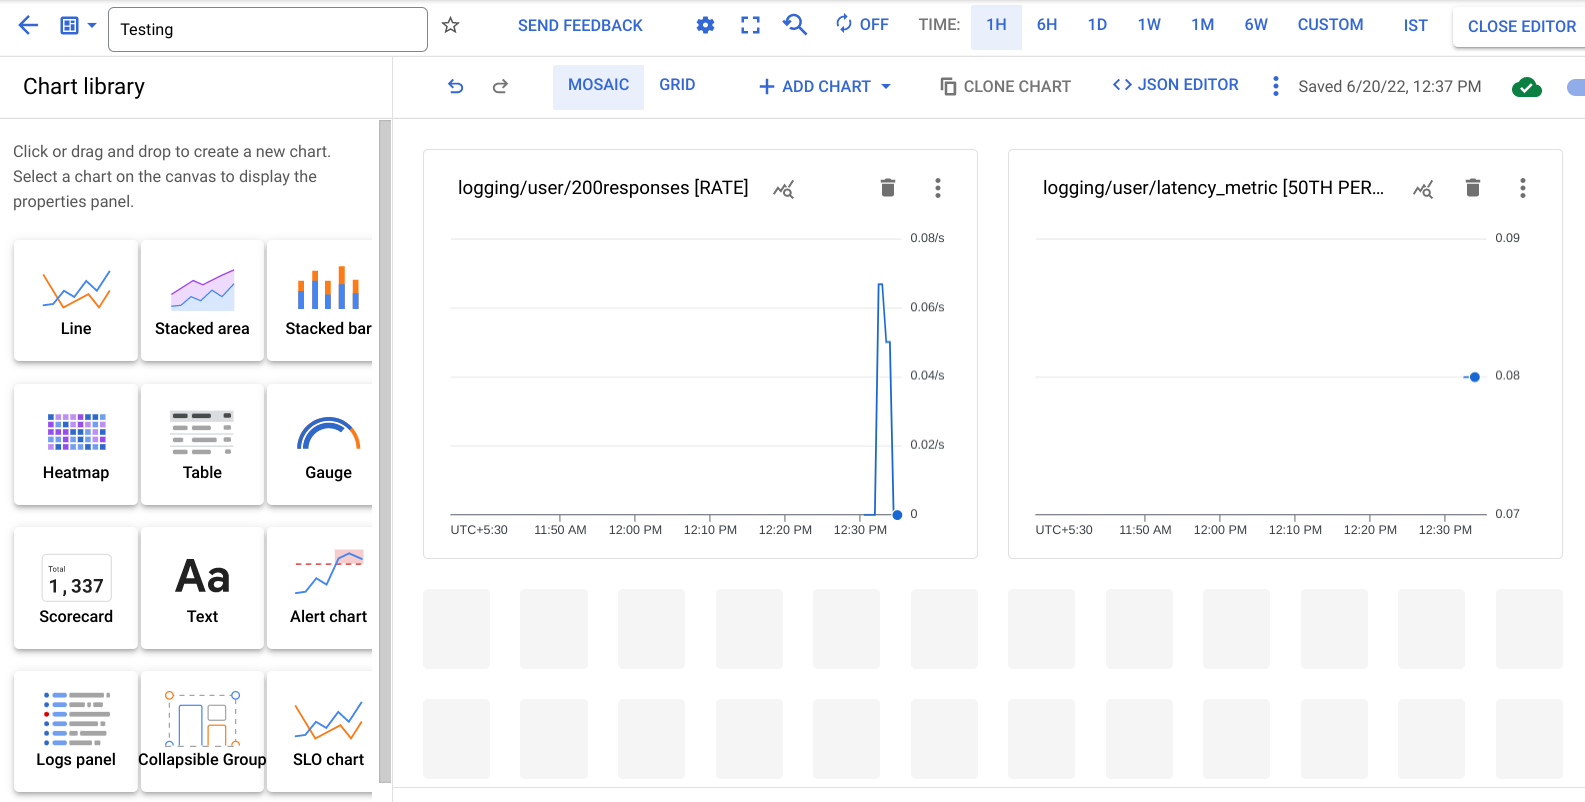
Try each of the four views to see which one best represents your latency metric.
- Experiment with the other charts. Challenge: can you edit or add one of the charts you made in Metric Explorer?
Task 7. Audit logging
Google Cloud provides Auditing of all Google Cloud resources by default. The audit logs answer the question "Who did what, when?" Let's look at Audit Logging, starting by creating a new Compute Engine (Compute Engine) virtual machine (VM). Launching a VM is an example of an audited privileged activity, so it generates logs.
Launch a VM to generate audit log events
-
In the Cloud Console, select Navigation menu > Compute Engine > VM instances.
-
Click Create Instance.
-
Set the following fields to the values below, leave all others at their defaults.
| Field | Value |
|---|---|
| Series | E2 |
| Machine Type > Preset | e2-micro |
| Region | |
| Zone | |
| Firewall | check Allow HTTP traffic |
- Click Create.
Click Check my progress to verify the objective.
Viewing audit logs in Cloud Logs Viewer
In Cloud Logs Viewer, you can view the audit logs for your project. Logs Viewer is versatile, allowing advanced filters and other log management functionality.
-
From the Cloud Console, return to Cloud Logs Viewer (Navigation menu > Logging > Logs Explorer).
-
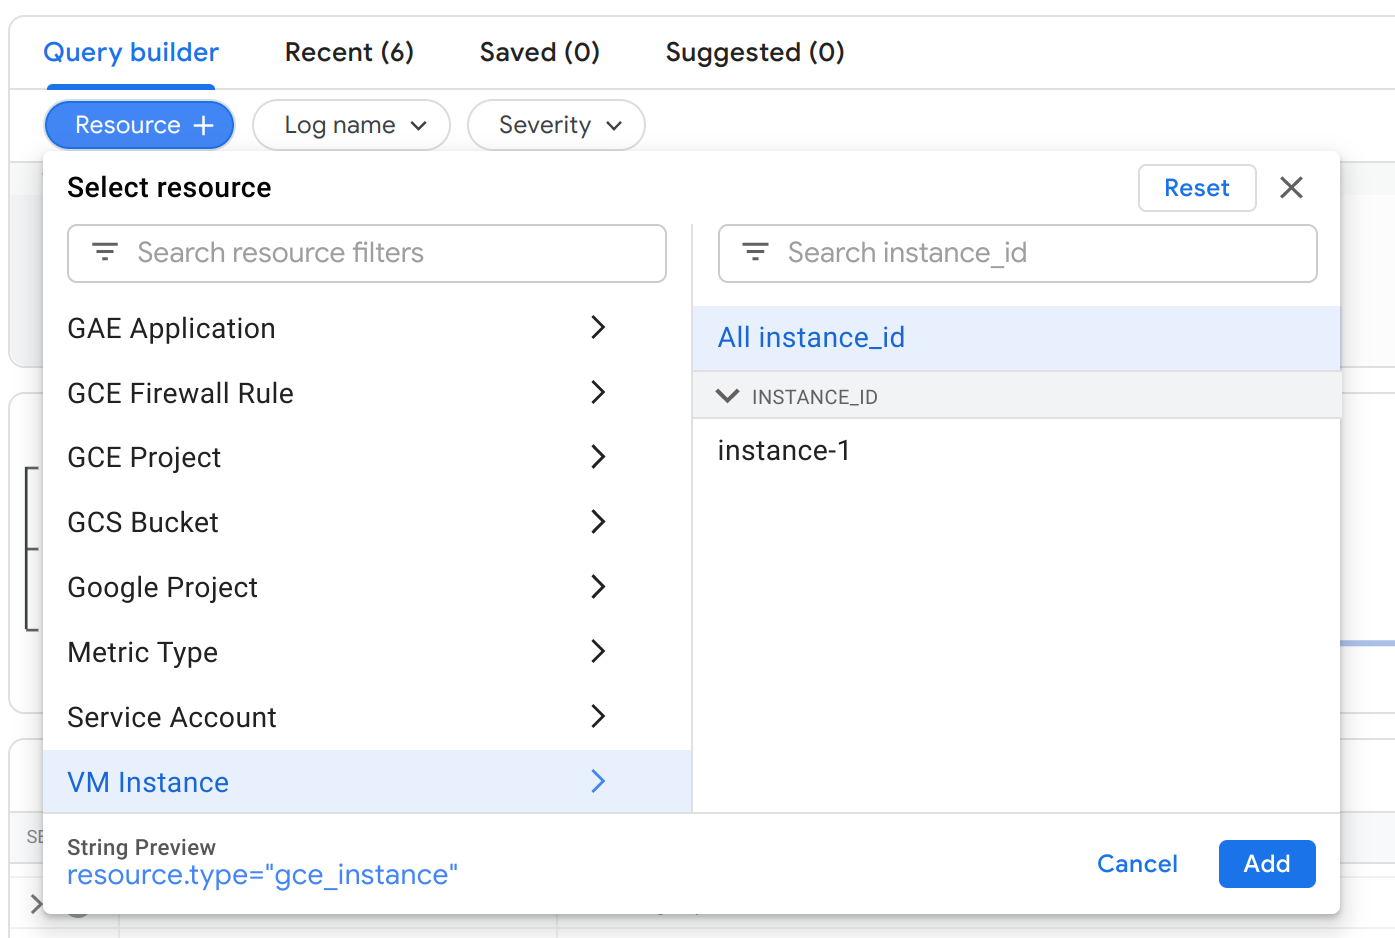
In the Resource selector, select VM Instance > All instance_id and click Apply:
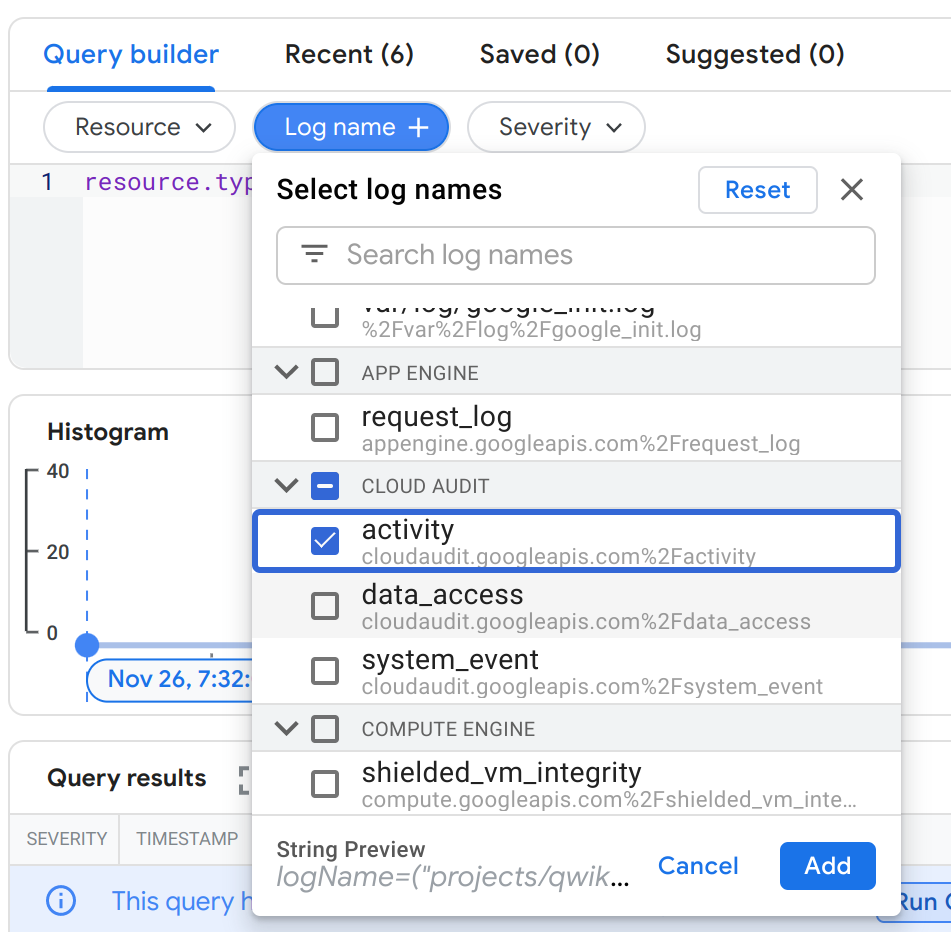
- In the Log Name selector dropdown, select activity under CLOUD AUDIT, and click Apply:
-
Click Run Query in the top right of the Query builder and view the two Audit log entries that correspond to the Create VM and Completed: Create VM entries you saw in the Activity Viewer.
-
Expand the Query Preview to look at all audit logs for all Google Cloud services. Remove line 1 to remove the gce_instance filter, then click Run Query.
View all activities performed in Google Cloud by any user.
- In any log row, click your Username (email) and click Show matching entries.
Notice in the Query Preview, this adds a new filter row to the Advanced Filter, and limits the result set to actions performed by you.
Task 8. Exporting logs
Cloud Logging retains logs for 30 days, after which they are deleted. To retain logs longer, you should export them to another storage system, or "sink", such as BigQuery. Cloud Logging allows you to set up automated exporting jobs so that all logs will automatically be exported. Logs may then be further analyzed with the features of your chosen sink.
Creating an export job
Set up an export job to send all audit logs to BigQuery for long-term storage and analysis.
-
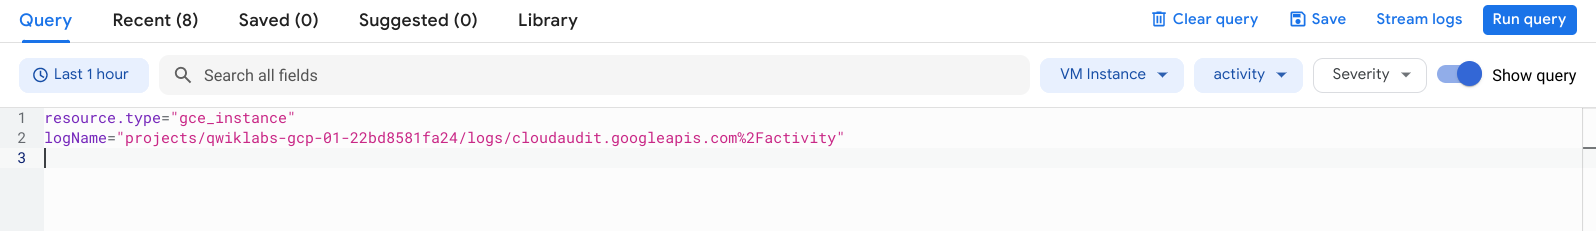
In the Cloud Logs Explorer window, add
resource.type="gce_instance"in the 1st line of the Query builder. -
Remove line 3 from the Query builder and click Run Query, so that you are viewing all audit logs for your Google Cloud Project:
- Click More Actions dropdown in the top right of the Query results section. Click Create Sink and set the following fields to the values below.
| Field | Value |
|---|---|
| Sink Name | AuditLogs |
| Select Sink Service | BigQuery dataset |
| Select BigQuery dataset | Create new BigQuery dataset, then name the new BigQuery dataset AuditLogs and click Create Dataset. |
- Click Create Sink.
Click Check my progress to verify the objective.
Congratulations!
Congratulations! In this lab, you learned how to use Cloud Logging to accumulate application logs in a single place, filter to reach the required log, understand how to create logs based metrics for advanced analysis, examine the audit logs use case, and export logs for compliance and/or advanced analysis needs.
Next steps / Learn more
Questions about Cloud Monitoring? See Cloud Monitoring Documentation.
See what else you can do with BigQuery.
For more information on advanced filters and on the various fields that you can use within your filter criteria, see:
Google Cloud training and certification
...helps you make the most of Google Cloud technologies. Our classes include technical skills and best practices to help you get up to speed quickly and continue your learning journey. We offer fundamental to advanced level training, with on-demand, live, and virtual options to suit your busy schedule. Certifications help you validate and prove your skill and expertise in Google Cloud technologies.
Manual Last Updated February 26, 2024
Lab Last Tested February 26, 2024
Copyright 2024 Google LLC All rights reserved. Google and the Google logo are trademarks of Google LLC. All other company and product names may be trademarks of the respective companies with which they are associated.