检查点
Create a Compute Engine instance
/ 35
Perform a query and create a chart
/ 30
Set up a query-based alert
/ 35
Set Up a Query-based Alert By Using MQL: Qwik Start
GSP1109
Overview
This lab shows you how to use Monitoring Query Language (MQL) to explore metrics, create charts, and set up a query-based alert.
Learning objectives
In this lab, you learn how to perform the following tasks:
-
Create a Compute Engine instance.
-
Navigate to the Query Editor.
-
Perform a query and create a chart.
-
Set up a query-based alert.
Task 1. Create a Compute Engine instance
To have a Google Cloud resource to collect metrics from, create a Compute Engine instance by completing the following steps:
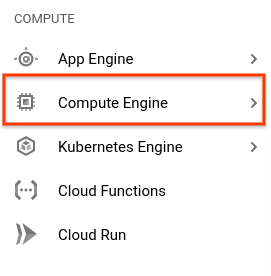
- From the Google Cloud console menu, select Compute Engine.
- Select Create instance, and then click Create.
Click Check my progress to verify the objective.
Task 2. Navigate to the Query Editor
To begin using MQL, do the following:
-
From the Google Cloud console menu, select Monitoring.
-
From the Monitoring menu, select Metrics Explorer.
-
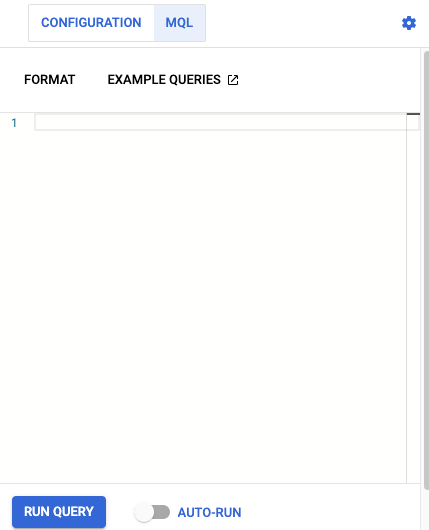
Select the CODE:PROMQL tab and then select MQL language from the bottom right corner.
The interface changes to the MQL Query Editor:
Use the Query Editor to construct, test, and run MQL queries.
Task 3. Perform a simple query and create a chart
Create a simple query that charts the CPU utilization of your instance:
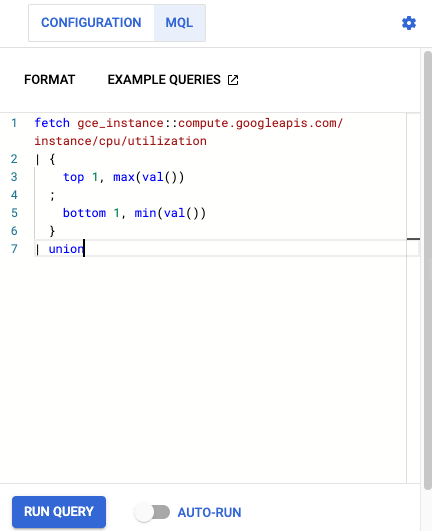
- Paste the following query into the Query Editor:
This query selects the time series with the maximum and minimum CPU utilization for charting. For more information on this query, see Combining selections with union.
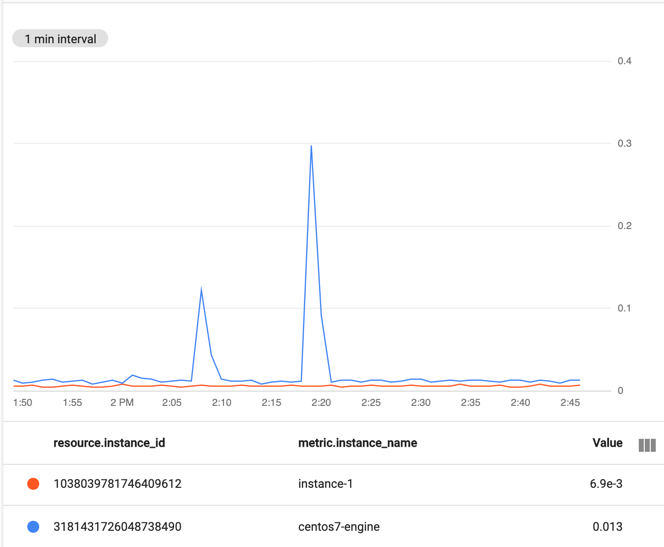
- Click Run Query. The chart displays a line, showing your instance's CPU utilization (
instance-1). It will take a few minutes for this chart to populate, if it does not wait a few minutes and hit Run Query again:
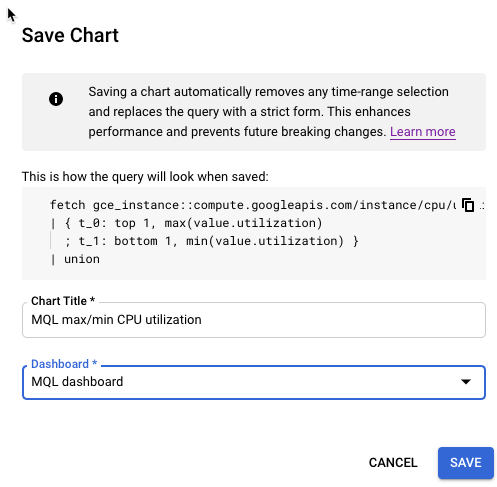
- To save the chart, click Save Chart. Give the chart a name and add it to either an existing dashboard or a new one. Then click Save.
The chart can be accessed by going to the Monitoring overview page, or if you saved it to a dashboard, by going to that dashboard's page.
Click Check my progress to verify the objective.
Task 4. Set up a query-based alert
You can create an alerting policy that monitors the results of a query. To create such an alerting policy, complete the following steps:
-
From the Google Cloud console menu, select Monitoring and then select Alerting.
-
From the Alerting page, click Edit Notification Channels. In this step, you configure an email address to receive alert notifications.
-
On the Notification channels page, scroll down to Email and click Add.
-
Enter the email address to which you want alert notifications sent in the Email Address field.
-
Enter a brief description of this channel, like Alert on-call, in the Display name field.
-
Click Save.
-
Go back to the Alerting page by clicking arrow_back Back on the page header.
-
From the Alerting page, click Create Policy.
-
On the toolbar, select MQL.
-
The Query Editor opens.
-
To be alerted when your instance's CPU usage time stays above 2 seconds, enter the following query:
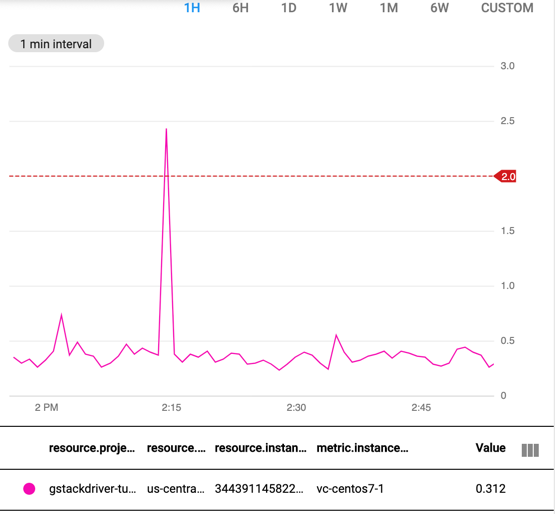
The condition operation establishes the performance threshold you want to alert on. In the example, the alerting policy tracks CPU usage time above 2 seconds.
- Click Run Query to see the selected data and a threshold line:
-
Click Next.
-
Enter a name for your condition, like MQL Quickstart condition.
-
Click Next to move to the next step, setting up notifications.
-
Select the notification channel you created previously, and click OK.
-
Click Next to move to the next step, providing steps to fix the issue.
-
Enter some text to be sent with any alert notification in the Documentation field. This text typically provides responders with information to help them address the problem. For this exercise, enter "Your CPU usage has exceeded 2 seconds."
-
Enter a name for the alerting policy in the Name the alert policy field. This value lets you distinguish among notifications from different alerting policies.
- Save your policy by clicking Create Policy.
Click Check my progress to verify the objective.
Congratulations!
In this lab, you learned how to use Monitoring Query Language (MQL) to explore metrics, create charts, and set up a query-based alert.
What's Next
-
Learn more about using the Query Editor.
-
Explore a set of MQL examples.
-
Learn more about MQL-based alerting policies.
-
Learn how to invoke MQL queries from the Cloud Monitoring API.
-
Explore the details of MQL in the MQL Reference.
Google Cloud training and certification
...helps you make the most of Google Cloud technologies. Our classes include technical skills and best practices to help you get up to speed quickly and continue your learning journey. We offer fundamental to advanced level training, with on-demand, live, and virtual options to suit your busy schedule. Certifications help you validate and prove your skill and expertise in Google Cloud technologies.
Manual Last Updated October 20, 2023
Lab Last Tested October 20, 2023
Copyright 2024 Google LLC All rights reserved. Google and the Google logo are trademarks of Google LLC. All other company and product names may be trademarks of the respective companies with which they are associated.

