체크포인트
Writing packets to a file
/ 100
Introducing tcpdump
Introduction
In this lab, you'll be introduced to tcpdump and some of its features. Tcpdump is the premier network analysis tool for information security and networking professionals. As an IT Support Specialist, having a solid grasp of this application is essential if you want to understand TCP/IP. Tcpdump will help you display network traffic in a way that's easier to analyze and troubleshoot.
You'll have 60 minutes to complete this lab.
What you'll do
- Command basics: You'll learn how to use tcpdump and what some of its flags do, as well as interpret the output.
- Packet captures: You'll practice saving packet captures to files, and reading them back.
There will be a few parts of this lab that require more than one terminal open at a time, so make sure you keep a terminal with another connection terminal open. This way, you can choose to SSH into a VM more than once.
Lab Setup
Start the lab
You'll need to start the lab before you can access the materials in the virtual machine OS. To do this, click the green “Start Lab” button at the top of the screen.

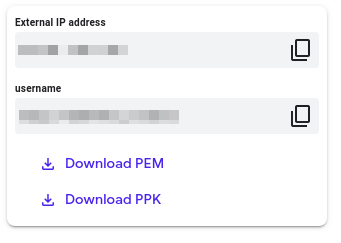
After you click the “Start Lab” button, you will see all the SSH connection details on the left-hand side of your screen. You should have a screen that looks like this:
Accessing the virtual machine
Please find one of the three relevant options below based on your device's operating system.
Option 1: Windows Users: Connecting to your VM
In this section, you will use the PuTTY Secure Shell (SSH) client and your VM’s External IP address to connect.
Download your PPK key file
You can download the VM’s private key file in the PuTTY-compatible PPK format from the Qwiklabs Start Lab page. Click on Download PPK.

Connect to your VM using SSH and PuTTY
-
You can download Putty from here
-
In the Host Name (or IP address) box, enter username@external_ip_address.
-
In the Connection list, expand SSH.
-
Then expand Auth by clicking on + icon.
-
Now, select the Credentials from the Auth list.
-
In the Private key file for authentication box, browse to the PPK file that you downloaded and double-click it.
-
Click on the Open button.
- Click Yes when prompted to allow a first connection to this remote SSH server. Because you are using a key pair for authentication, you will not be prompted for a password.
Common issues
If PuTTY fails to connect to your Linux VM, verify that:
- You entered <username>@<external ip address> in PuTTY.
- You downloaded the fresh new PPK file for this lab from Qwiklabs.
- You are using the downloaded PPK file in PuTTY.
Option 2: OSX and Linux users: Connecting to your VM via SSH
Download your VM’s private key file.
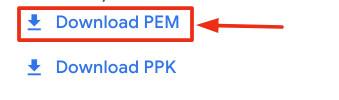
You can download the private key file in PEM format from the Qwiklabs Start Lab page. Click on Download PEM.
Connect to the VM using the local Terminal application
A terminal is a program which provides a text-based interface for typing commands. Here you will use your terminal as an SSH client to connect with lab provided Linux VM.
-
Open the Terminal application.
-
To open the terminal in Linux use the shortcut key Ctrl+Alt+t.
-
To open terminal in Mac (OSX) enter cmd + space and search for terminal.
-
-
Enter the following commands.
You will most likely find the PEM file in Downloads. If you have not changed the download settings of your system, then the path of the PEM key will be ~/Downloads/qwikLABS-XXXXX.pem

Option 3: Chrome OS users: Connecting to your VM via SSH
Download your VM’s private key file.
You can download the private key file in PEM format from the Qwiklabs Start Lab page. Click on Download PEM.
Connect to your VM
-
Add Secure Shell from here to your Chrome browser.
-
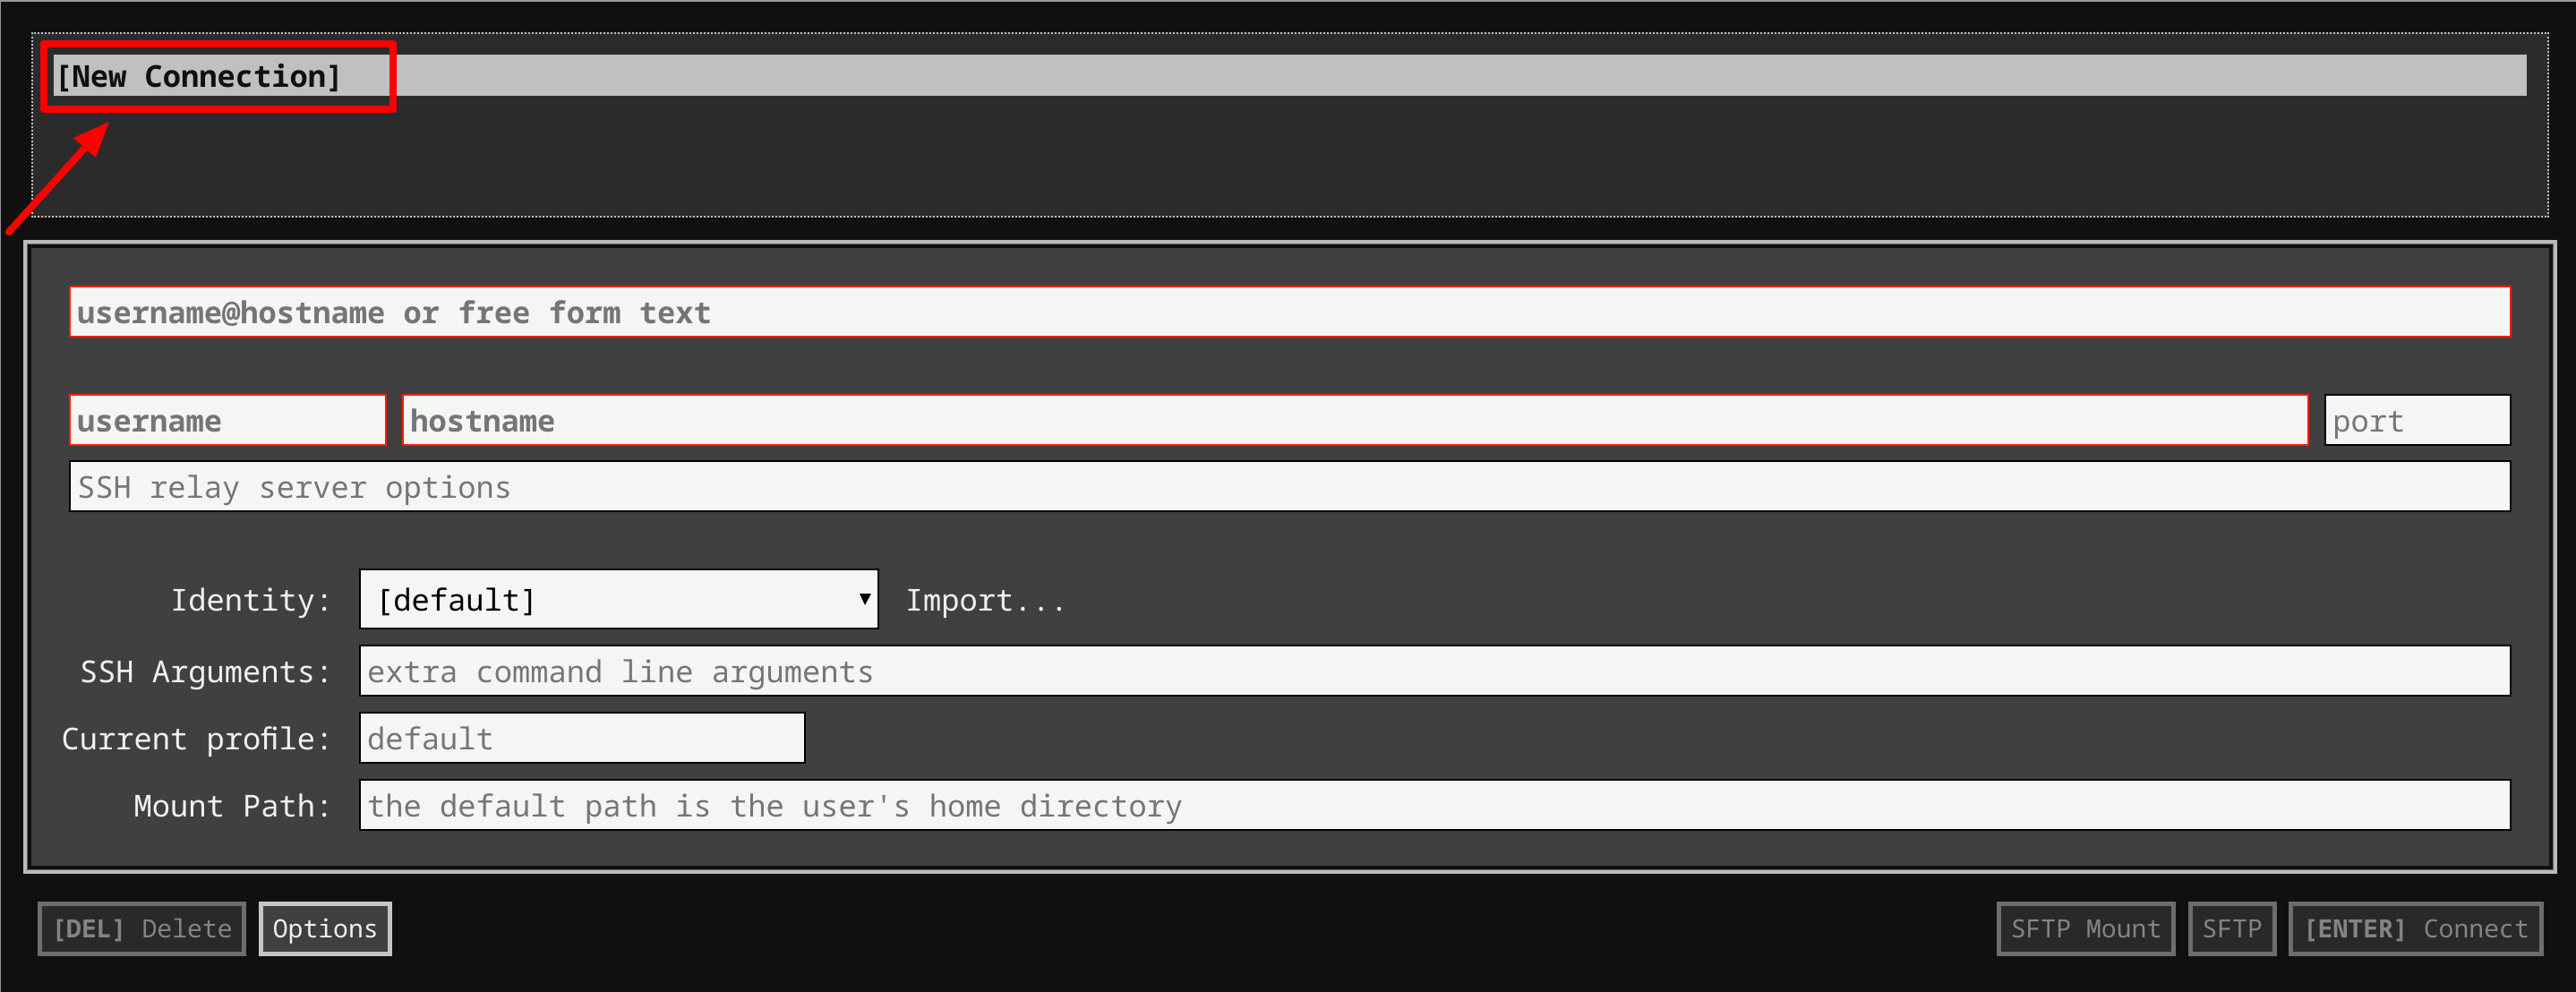
Open the Secure Shell app and click on [New Connection].
-
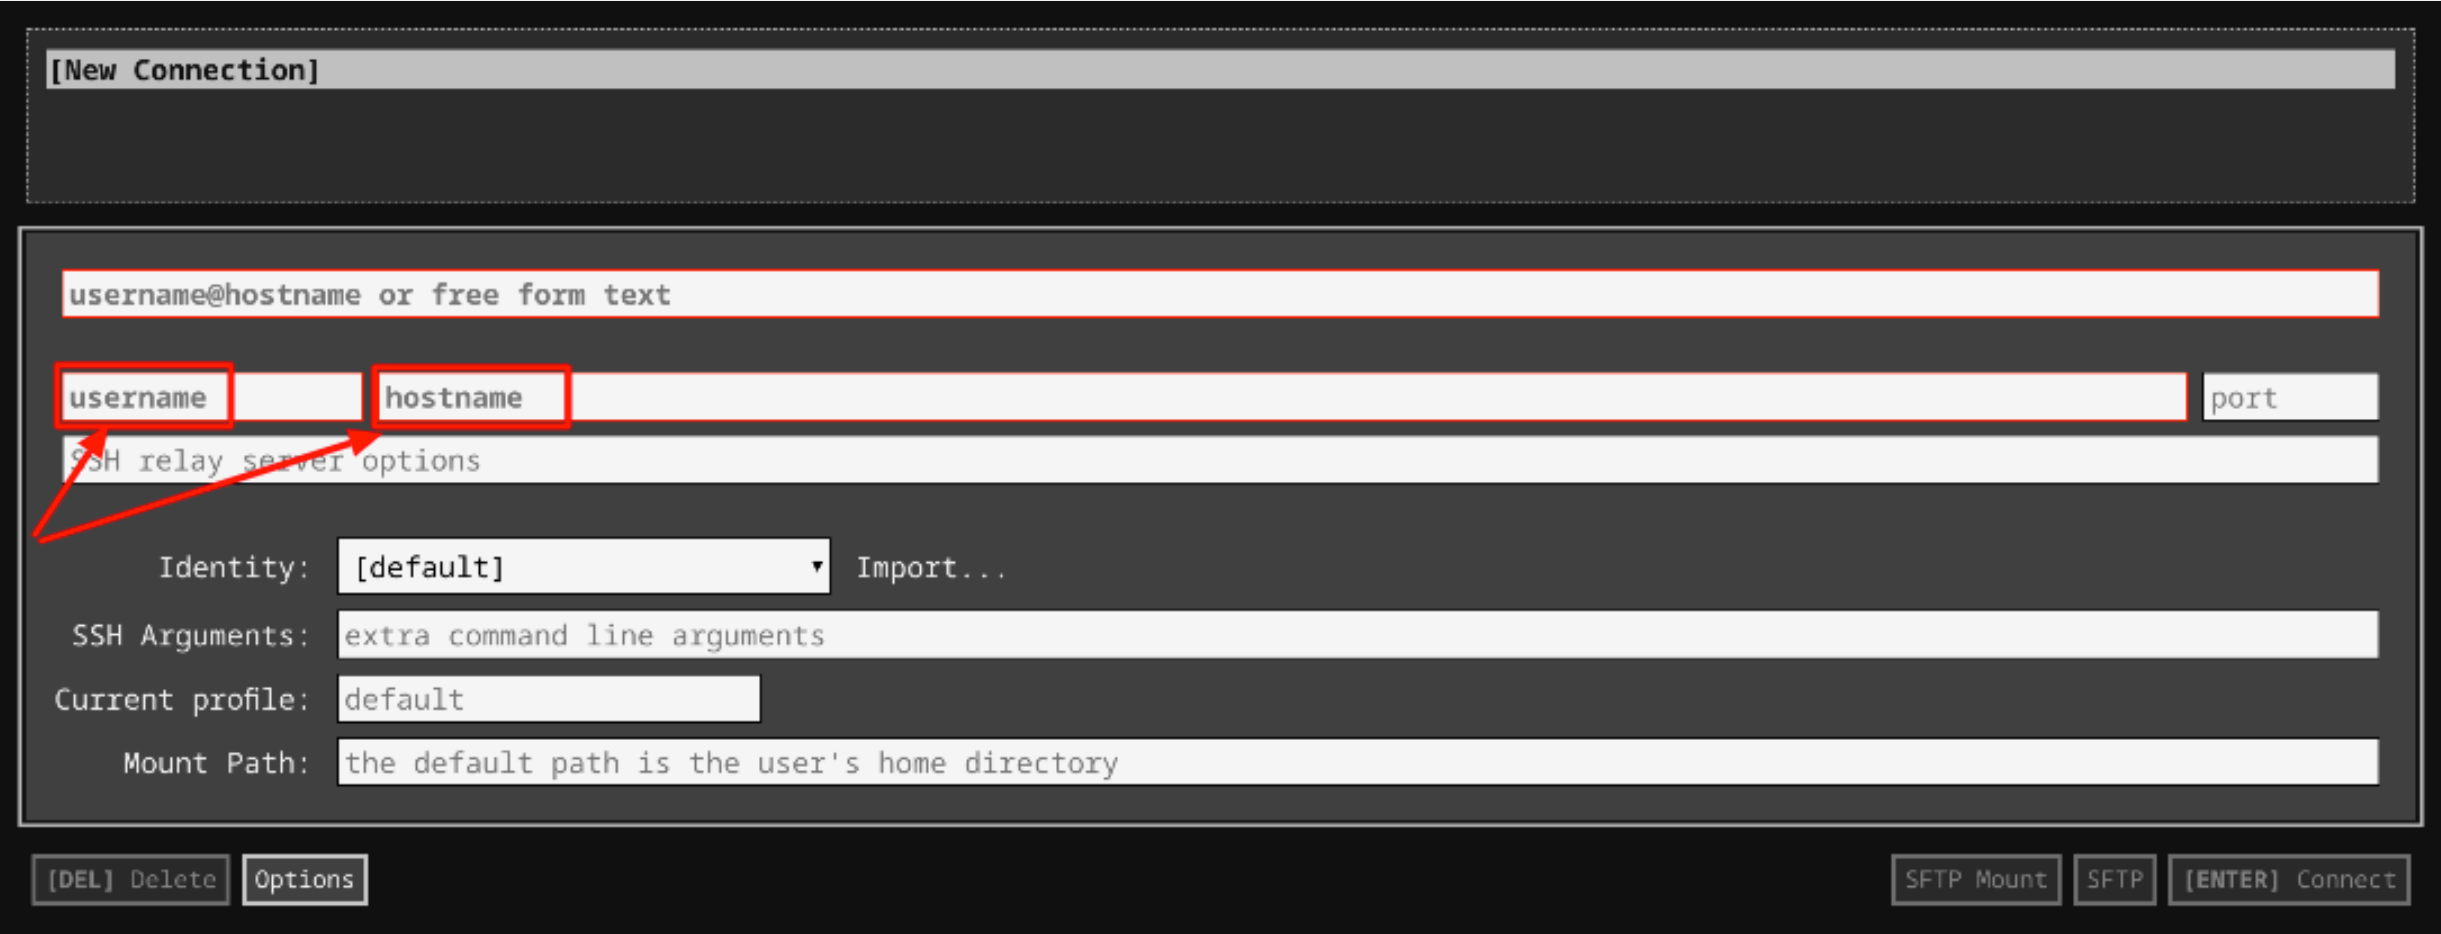
In the username section, enter the username given in the Connection Details Panel of the lab. And for the hostname section, enter the external IP of your VM instance that is mentioned in the Connection Details Panel of the lab.
-
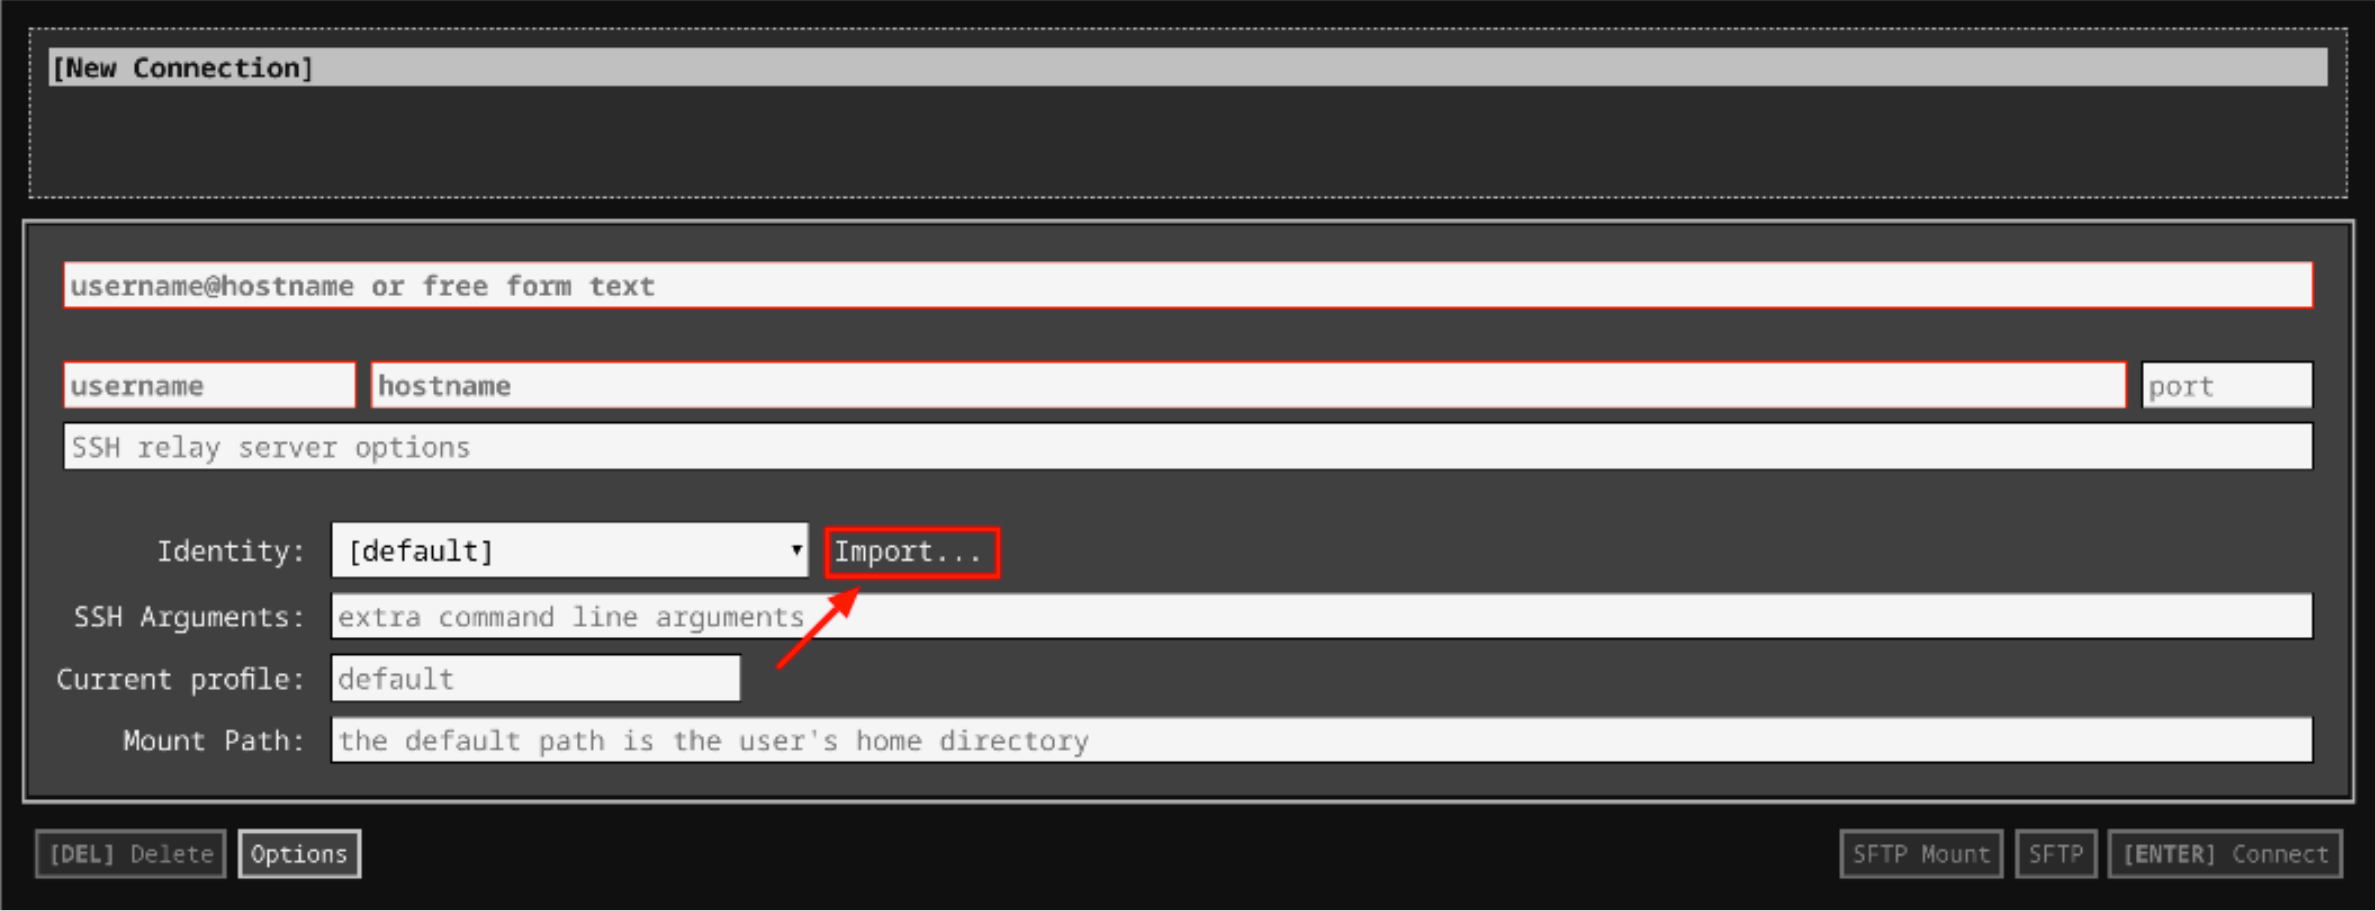
In the Identity section, import the downloaded PEM key by clicking on the Import… button beside the field. Choose your PEM key and click on the OPEN button.
-
Once your key is uploaded, click on the [ENTER] Connect button below.
-
For any prompts, type yes to continue.
-
You have now successfully connected to your Linux VM.
You're now ready to continue with the lab!
Using tcpdump
Now, you'll perform some tasks using tcpdump, starting with basic usage and working up to slightly more advanced topics.
Basic Usage
We'll kick things off by introducing tcpdump and running it without any options. Head's up that tcpdump does require root or administrator privileges in order to capture traffic, so every command must begin with sudo. At a minimum, you must specify an interface to listen on with the -i flag. You may want to check what the primary network interface name is using ip link. In this case, we'll be using the interface ens4 for all the examples; this is not necessarily the interface you'd use on your own machine, though.
To use tcpdump to start listening for any packets on the interface, enter the command below.
Head's up: This command will fill your terminal with a constant stream of text as new packets are read. It won't stop until you press Ctrl+C.
This will output some basic information about packets it sees directly to standard out. It'll continue to do this until we tell it to stop. Press Ctrl+C to stop the stream at any time.
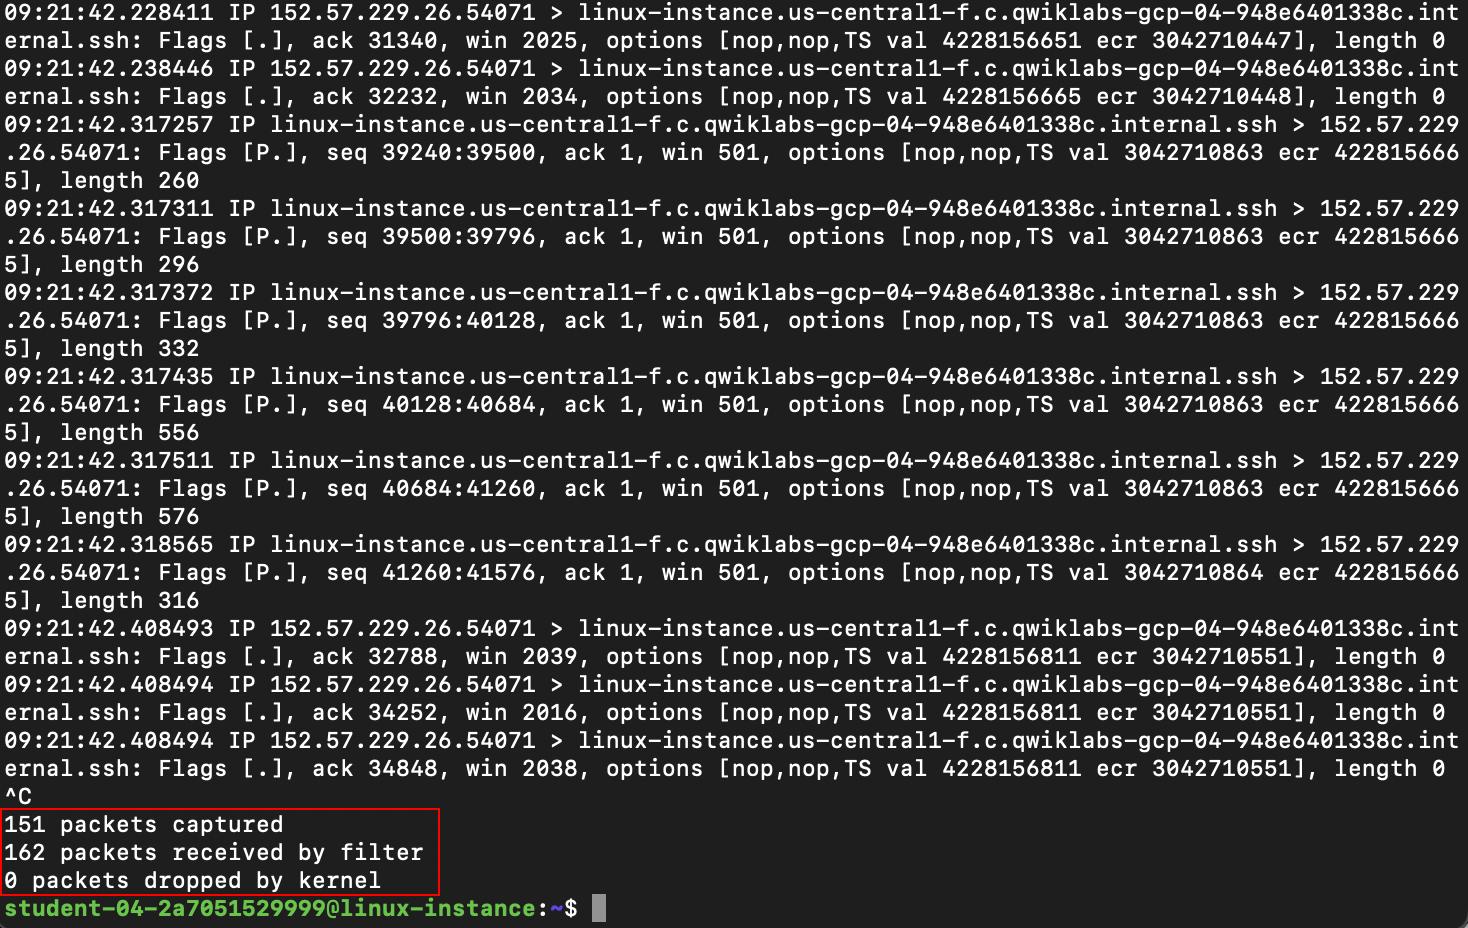
You can see that once tcpdump exits, it prints a summary of the capture performed, showing the number of packets captured, filtered, or dropped:
By default, tcpdump will perform some basic protocol analysis. To enable more detailed analysis, use the -v flag to enable more verbose output. By default, tcpdump will also attempt to perform reverse DNS lookups to resolve IP addresses to hostnames, as well as replace port numbers with commonly associated service names. You can disable this behavior using the -n flag. It's recommended that you use this flag to avoid generating additional traffic from the DNS lookups, and to speed up the analysis. To try this out, enter this command:
Head's up: This command will fill your terminal with a constant stream of text as new packets are read. It won't stop until you press Ctrl+C.
You can see how the output now provides more details for each packet:
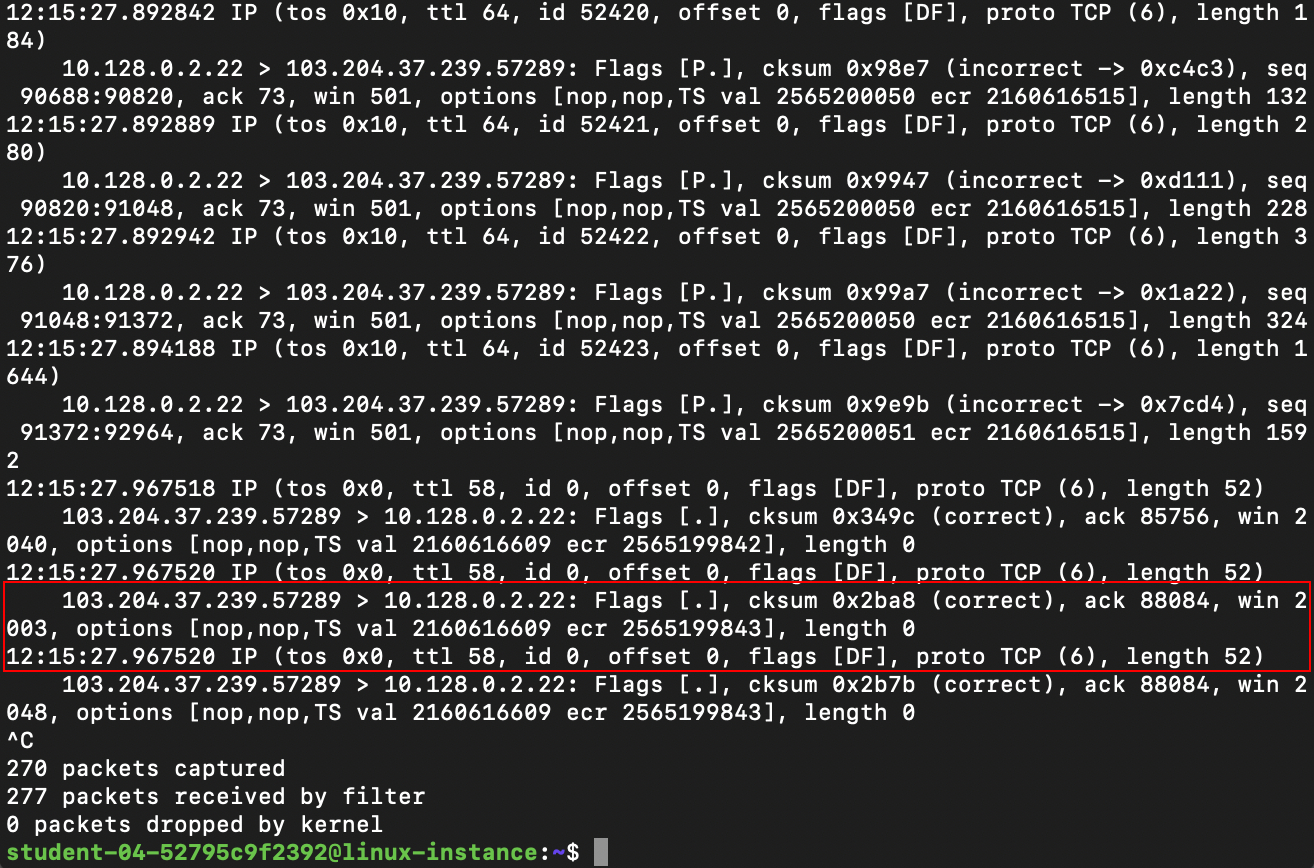
Without the verbose flag, tcpdump only gives us:
- the layer 3 protocol, source, and destination addresses and ports
- TCP details, like flags, sequence and ack numbers, window size, and options
With the verbose flag, you also get all the details of the IP header, like time-to-live, IP ID number, IP options, and IP flags.
Filtering
Let's explore tcpdump's filter language a bit next, along with the protocol analysis. Tcpdump supports a powerful language for filtering packets, so you can capture only traffic that you care about or want to analyze. The filter rules go at the very end of the command, after all other flags have been specified. We'll use filtering to only capture DNS traffic to a specific DNS server. Then, we'll generate some DNS traffic, so we can demonstrate tcpdump's ability to interpret DNS queries and responses.
Go ahead and enter the command now. It'll run until you stop it using Ctrl+C like the previous command, but you shouldn't see any output yet.
Let's analyze how this filter is constructed, and what exactly it's doing. Host 8.8.8.8 specifies that we only want packets where the source or destination IP address matches what we specify (in this case 8.8.8.8). If we only want traffic in one direction, we could also add a direction qualifier, like dst or src (for the destination and source IP addresses, respectively). However, leaving out the direction qualifier will match traffic in either direction.
Next, the port 53 portion means we only want to see packets where the source or destination port matches what we specify (in this case, DNS). These two filter statements are joined together with the logical operator "and". This means that both halves of the filter statement must be true for a packet to be captured by our filter.
Now, Go ahead and connect to second terminal by following the instructions given in the section Accessing the virtual machine. Click on Accessing the virtual machine from the navigation pane at the right side. and run this command:
You should see this output to the screen:
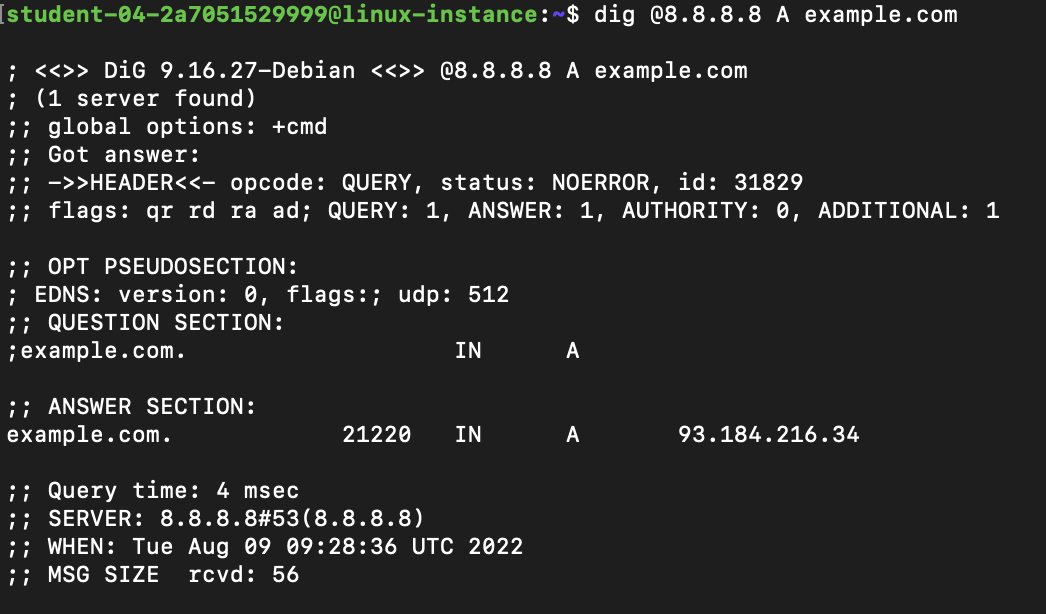
This uses the dig utility to query a specific DNS server (in this case 8.8.8.8), asking it for the A record for the specified domain (in this case "example.com").
Back in the original terminal, you should now see two captured packets, as our filter rules should filter out any other traffic:
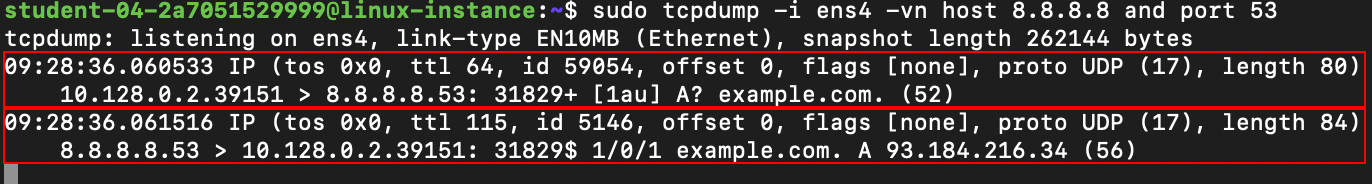
The first one is the DNS query, which is our question (from the second terminal) going to the server. Note that, in this case, the traffic is UDP. Tcpdump's analysis of the DNS query begins right after the UDP checksum field. It starts with the DNS ID number, followed by some UDP options, then the query type (in this case A? which means we're asking for an A record). Next is the domain name we're interested in (example.com).

The second packet is the response from the server, which includes the same DNS ID from the original query, followed by the original query. After this is the answer to the query, which contains the IP address associated with the domain name.

You can stop the tcpdump session in the original terminal now by pressing Ctrl+C. Make sure to leave your second terminal window open; you'll need it again soon.
Up next, we'll explore tcpdump's ability to write packet captures to a file, then read them back from a file.
Saving Captured Packets
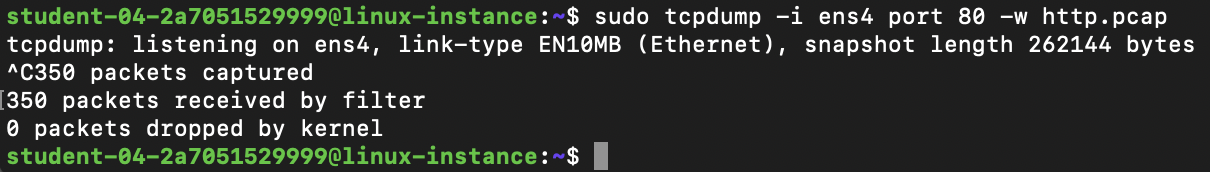
In one of your terminals, run this command:
This starts a capture on our ens4 interface that filters for only HTTP traffic by specifying port 80. The -w flag indicates that we want to write the captured packets to a file named http.pcap. Like the other captures, this will run until you force it to stop with Ctrl+C.
Once that's running, switch back to your second terminal, where you'll generate some http traffic that'll be captured in the original terminal. Don't stop the capture you started with the previous command just yet. (If you have, you can restart it now.)
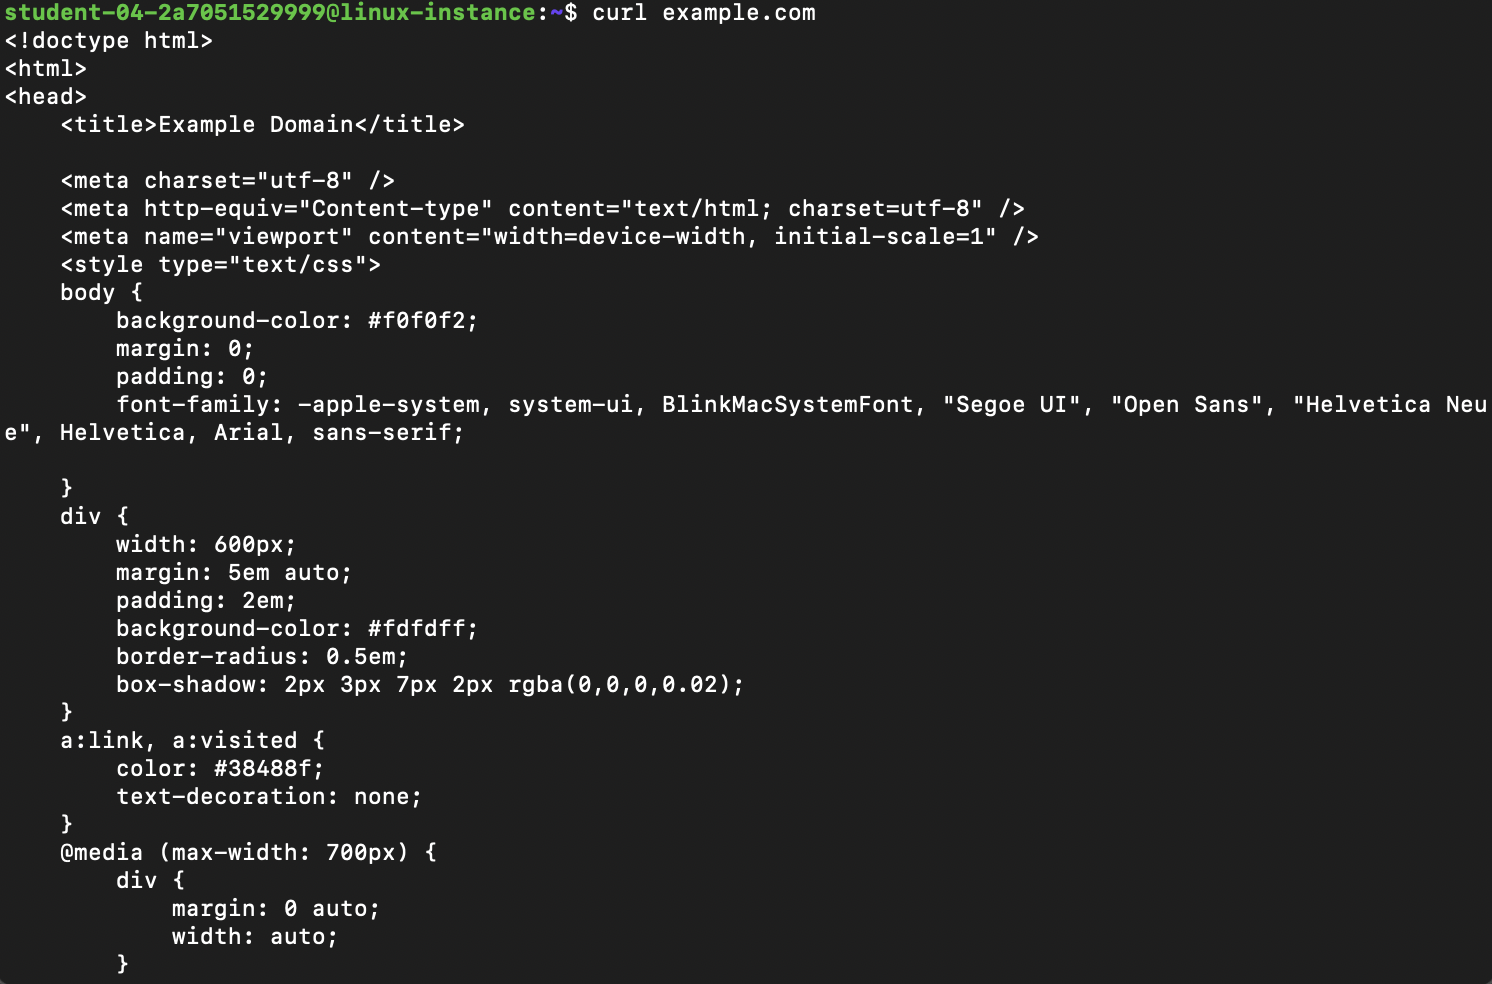
In the second terminal window, execute this command to generate some traffic:
This command fetches the html from example.com and prints it to your screen. It should look like the below. (Head's up that only the first part of the output is shown here.)
Once that's done, close the second terminal window and return to the original terminal where the capture is running. Stop the capture with Ctrl+C. It should return a summary of the number of packets captured:
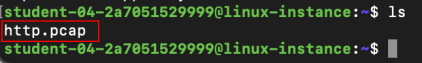
A binary file containing the packets we just captured, called http.pcap, will also have been created. Don't try to print the contents of this file to the screen; since it's a binary file, it'll display as a bunch of garbled text that you won't be able to read.
Somewhere in that file, there's information about the packets created when you pulled down the html from example.com. We can read from this file using tcpdump now, using this command:
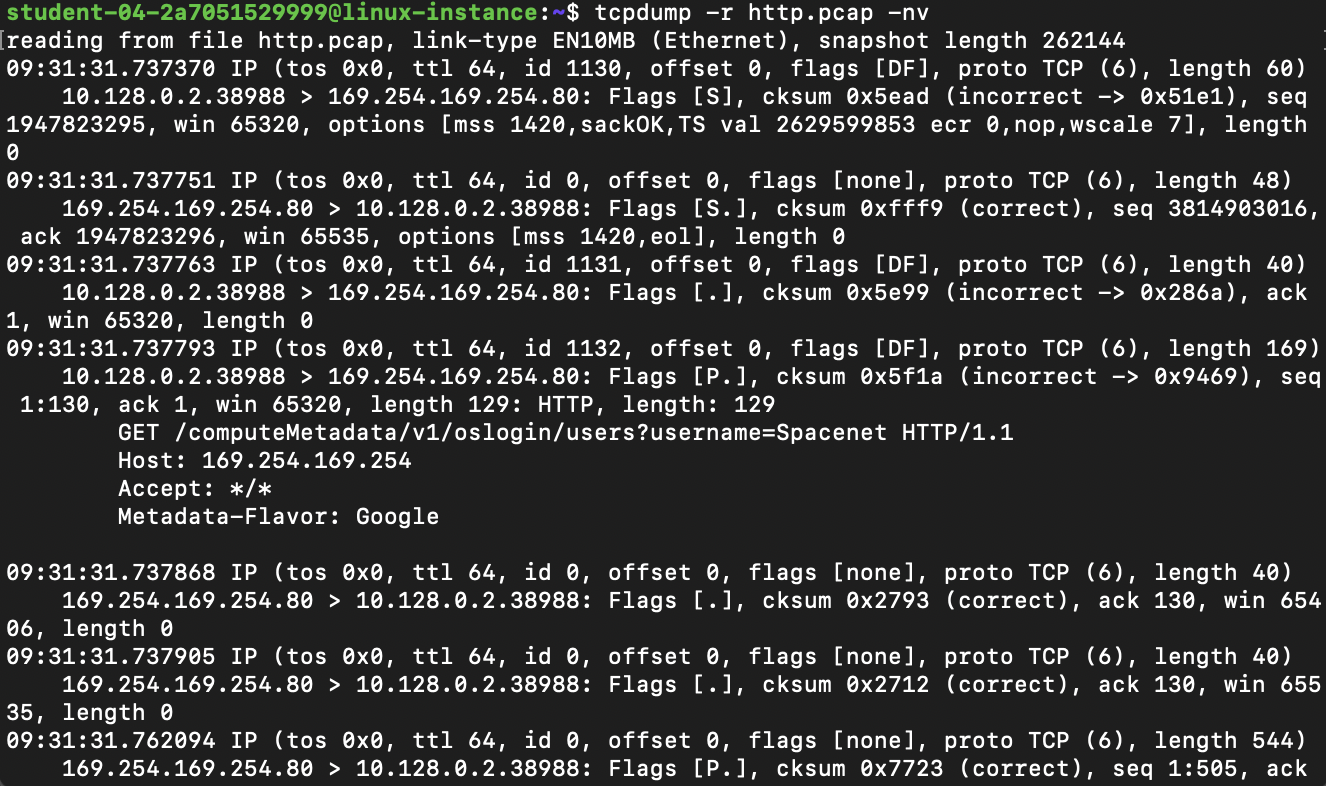
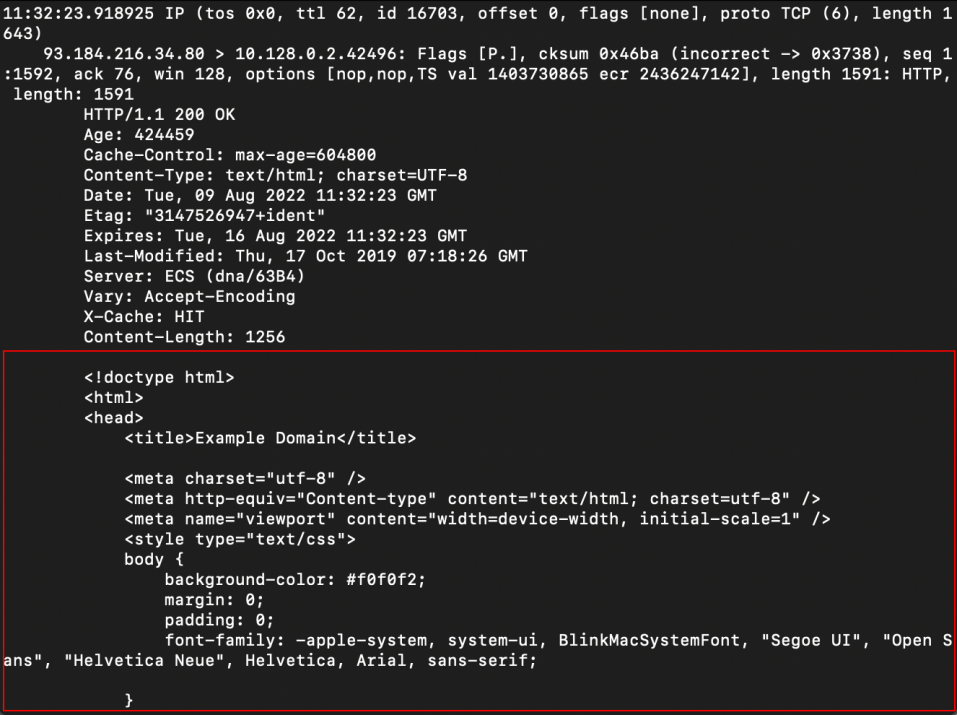
Note that we don't need to use sudo to read packets from a file. Also note that tcpdump writes full packets to the file, not just the text-based analysis that it prints to the screen when it's operating normally. For example, somewhere in the output you should see the html that was returned as the body of the original query in the other terminal:
Click Check my progress to verify the objective.
Conclusion
Congrats! You've successfully used tcpdump for basic network monitoring, including filtering for specific traffic. You've also learned how to interpret the information that tcpdump outputs about a packet, along with how to save and load summaries of the packets captured during a session
End your lab
When you have completed your lab, click End Lab. Qwiklabs removes the resources you’ve used and cleans the account for you.
You will be given an opportunity to rate the lab experience. Select the applicable number of stars, type a comment, and then click Submit.
The number of stars indicates the following:
- 1 star = Very dissatisfied
- 2 stars = Dissatisfied
- 3 stars = Neutral
- 4 stars = Satisfied
- 5 stars = Very satisfied
You can close the dialog box if you don't want to provide feedback.
For feedback, suggestions, or corrections, please use the Support tab.