Checkpoint
Explore your billing data in BigQuery
/ 20
Run the query to get service.description column values
/ 20
Run a query to find out which services are used the most and least
/ 20
Run the query to get the region in which the Google Cloud service ran
/ 20
Run the query to find out which regions are used the most and the least by a service
/ 20
Visualizing Billing Data with Looker Studio
GSP622

Overview
Looker Studio allows you to unlock the power of your data with interactive dashboards and beautiful reports that inspire smarter business decisions.
With Looker Studio, you can:
- Connect: Easily access a wide variety of data. With built-in and partner connectors, you can connect to virtually any type of data stream.
- Visualize: Turn your data into compelling stories of data visualization art. You can quickly build dashboards with Looker Studio's web-based reporting tools.
- Share: Share your reports and dashboards with individuals, teams, or the world. Collaborate in real time. Embed your report on any page.
In this lab, you create data visualizations with Looker Studio. You first explore a sample Google Cloud bill and learn how to export the billing data to BigQuery — Google's serverless, highly scalable enterprise data warehouse that is designed to make data analysts more productive with unmatched price-performance.
After running a few SQL queries on your billing data, you export those metrics to Looker Studio, where you explore the service's chief features and build your own billing data visualizations.
What you'll learn
In this lab, you learn how to:
- Use the billing service in the Google Cloud console to explore projects and their consumption of cloud computing resources.
- Export billing data to BigQuery.
- Explore your billing data in BigQuery.
- Run SQL queries to better understand a project's consumption of Google Cloud services.
- Export your queried data to Looker Studio.
- Explore Looker Studio tools and generate visualizations with your queried data.
Once you're ready, scroll down and follow the steps below to get your lab environment set up.
Setup and requirements
Before you click the Start Lab button
Read these instructions. Labs are timed and you cannot pause them. The timer, which starts when you click Start Lab, shows how long Google Cloud resources will be made available to you.
This hands-on lab lets you do the lab activities yourself in a real cloud environment, not in a simulation or demo environment. It does so by giving you new, temporary credentials that you use to sign in and access Google Cloud for the duration of the lab.
To complete this lab, you need:
- Access to a standard internet browser (Chrome browser recommended).
- Time to complete the lab---remember, once you start, you cannot pause a lab.
How to start your lab and sign in to the Google Cloud console
-
Click the Start Lab button. If you need to pay for the lab, a pop-up opens for you to select your payment method. On the left is the Lab Details panel with the following:
- The Open Google Cloud console button
- Time remaining
- The temporary credentials that you must use for this lab
- Other information, if needed, to step through this lab
-
Click Open Google Cloud console (or right-click and select Open Link in Incognito Window if you are running the Chrome browser).
The lab spins up resources, and then opens another tab that shows the Sign in page.
Tip: Arrange the tabs in separate windows, side-by-side.
Note: If you see the Choose an account dialog, click Use Another Account. -
If necessary, copy the Username below and paste it into the Sign in dialog.
{{{user_0.username | "Username"}}} You can also find the Username in the Lab Details panel.
-
Click Next.
-
Copy the Password below and paste it into the Welcome dialog.
{{{user_0.password | "Password"}}} You can also find the Password in the Lab Details panel.
-
Click Next.
Important: You must use the credentials the lab provides you. Do not use your Google Cloud account credentials. Note: Using your own Google Cloud account for this lab may incur extra charges. -
Click through the subsequent pages:
- Accept the terms and conditions.
- Do not add recovery options or two-factor authentication (because this is a temporary account).
- Do not sign up for free trials.
After a few moments, the Google Cloud console opens in this tab.

Task 1. Explore the demo projects and their associated bills
In this task you explore your billing data and identify the dataset you want to focus on. This lab provides sample data for you to use.
-
In the Google Cloud console, in the Navigation menu (
), click Billing.
-
In the Billing window, click Manage billing accounts.
-
Click GCP Cost Management Billing Demo.
The Billing Account Overview window opens.
-
In the Billing account pane, click Manage.
The Google Cloud projects associated with this billing account are listed:
- CTG - Storage
- CTG - Dev
- CTG - Prod
- CTG - Sandbox
These four Google Cloud projects illustrate a common enterprise schema, where you have different projects for development, production, storage, and sandbox testing.
Note: The billing data that you work with in this lab is associated with these four projects. The data is in the form of a CSV (spreadsheet) file. -
In the Cloud console, in the Navigation menu (
This window provides an overview of the Billing Account.
-
Scroll down to explore the data and charts that track your billing account.
-
In the Cloud console, in the Navigation menu (
This window provides a report for your billing account. Notice the cost trends per project, when prices rise and fall, and the ability to filter the report.
Task 2. Export your data to BigQuery: Information only
In this task you use BigQuery to easily query and filter large datasets, aggregate results, and perform complex operations to optimize data analysis. BigQuery is a fully managed data warehouse that runs on Google Cloud.
The billing data you explored in the previous section was exported to BigQuery when this lab was spun up. This section describes the process for information purposes only.
-
In the Google Cloud console, in the Navigation menu (
The Billing export window opens with the BigQuery Export tab selected by default.
-
Click Edit settings to show the export options.
Note: This option is disabled for you because you don't have permission to configure billing export. -
Click Projects, and then select the project that contains your billing account.
-
Click Billing export dataset, and then set the BigQuery dataset where you want to host this data.
-
Click Save.
This initiates a job where your billing data is saved as a table in the selected BigQuery dataset.
Note that a billing export takes some time to populate (a few hours to a day).
The billing data for this lab has already been exported to a table in BigQuery. Following BigQuery's project.dataset.table convention, the full path to the billing data is:
You use this path to query project data.
Task 3. Explore your billing data in BigQuery
In this task you use an SQL query in BigQuery to see what information is available. The billing data was automatically exported into BiqQuery when the lab was spun up.
-
In the Cloud console, in the Navigation menu (
-
Under Select a recent project, click the tile with your Project ID.
Note: Your Project ID is in the left pane in your lab instructions. -
In the Welcome dialog, click Done.
The BigQuery console opens. The Explorer pane displays your project. Your project name is your Project ID.
-
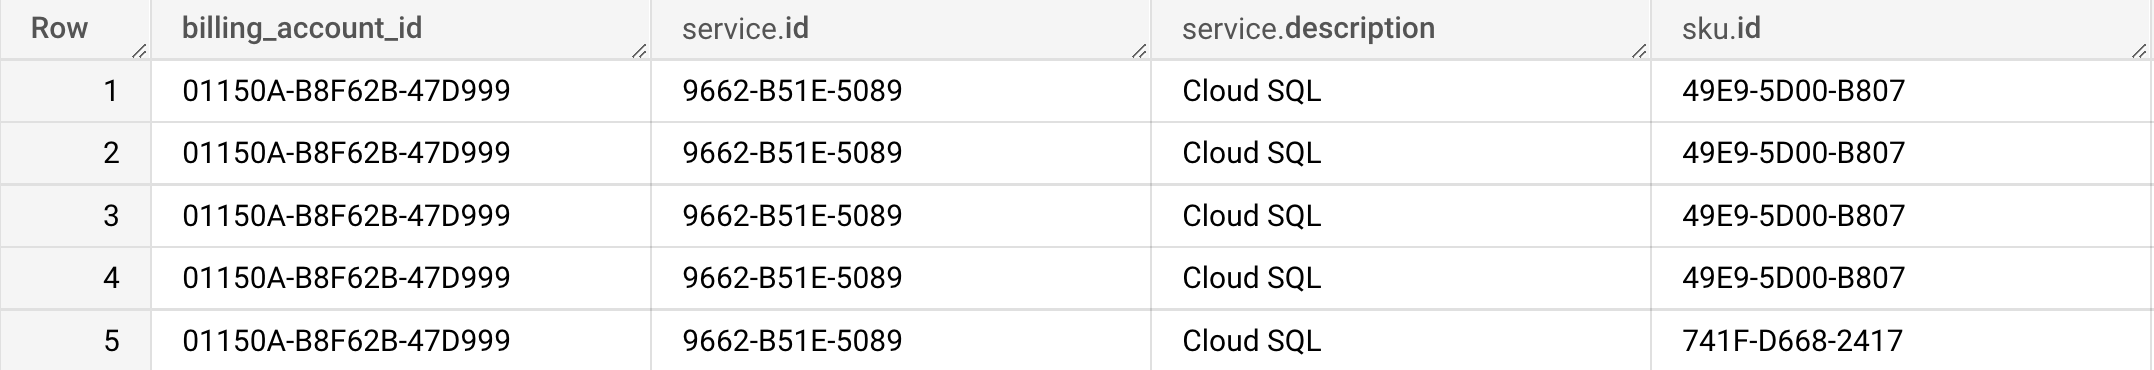
In the Query Editor, type the following, and then click Run:
SELECT * returns all column values from a specified table.
Your results should look similar to this:
Check my progress
Click Check my progress to verify your performed task. If you have successfully run a query to get all the column values from a table, you will receive an assessment score.
Answer the following questions
- Inspect the table (be sure to scroll left and right) and answer the following questions so you become more familiar with this data:
Under the table in Query results, there are 1 million plus rows of data.
You found the answer to this question by looking at the BigQuery table created in your first SQL query. For more complicated questions, you would run more complicated SQL queries to analyze your data and gain valuable insights.
Task 4. Perform SQL queries in BigQuery and build data visualizations with Looker Studio
In this task, you ask two questions, and use BigQuery to get that information. You then use Looker Studio to build reports with data visualizations to share those insights.
In the previous task you explored a sample billing account in BigQuery that has millions of rows of information. For this information to be useful you must be able to analyze the data to obtain specific information. In BigQuery, you run SQL queries to answer questions to obtain that specific information.
Question 1: Which service types are most and least used?
You want to find which service types are most and least used, so you must determine:
- What types of services the four projects use
- Which service types are most and least used
For the answers, you run SQL queries on the billing data hosted in BigQuery.
Query to identify service types
-
In the Query editor, clear the current query.
-
In the Query editor, type the following, and then click Run:
This query reveals which service is associated with each log.
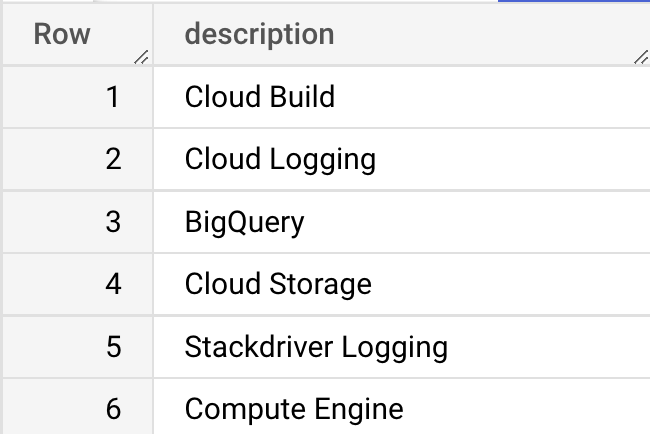
The service.description column tells you what Google Cloud service is associated with each log. The GROUP BY keyword aggregates result-set rows that share common criteria (in this case the service description) and returns all of the unique entries found for such criteria.
The results show that the four projects use 12 different types of Google Cloud services:
Check my progress
Click Check my progress to verify your performed task. If you have successfully run a query to get service.description column values, you will receive an assessment score.
Query to find which service types are most and least used
-
In the Query editor, clear the current query.
-
In the Query editor, type the following, and then click Run:
This query determines which service types are most and least used.
The COUNT(*)function returns the number of rows that share the same criteria (in this case the service description).
Your results should look similar to the example table below, but your actual query output will be different.
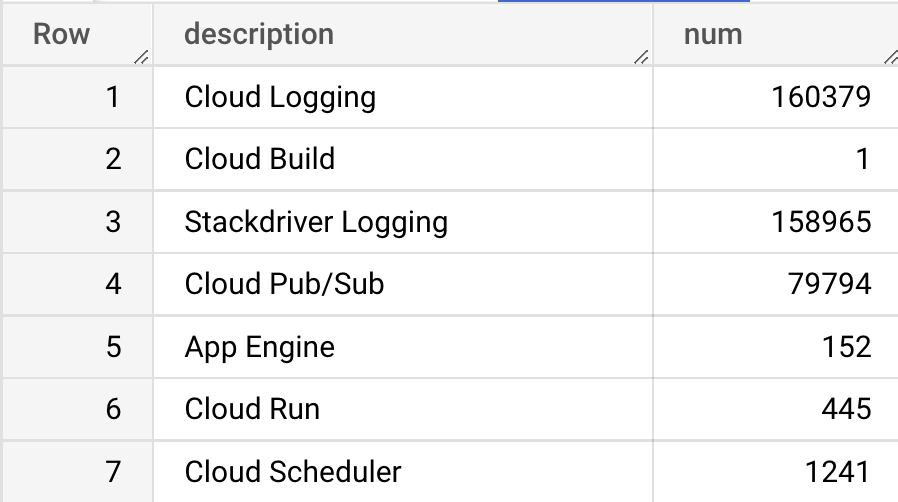
In this example, based on service logs, the projects use Compute Engine the most (791,413 logs), and App Engine (152 logs) and Cloud Build (1 log) the least.
Check my progress
Click Check my progress to verify your performed task. If you have successfully run a query to find out which services are used the most and least, you will receive an assessment score.
Visualize in Looker Studio
-
Open Looker Studio in a new tab.
-
Click Create > Explorer.
-
Select Country and Enter Company name.
-
Agree to the Terms of Service, and then click Continue.
-
In email preferences, select Yes to all (this is connected to your temporary student email).
-
Click Continue.
-
In the Add Data pane, click Create New Data.
-
In the Google Connectors window, select BigQuery.
-
Click Authorize.
-
In Recent Projects, select Custom Query.
-
In Billing Project, select your project ID.
-
In the Customer Query pane, type the query you used previously:
-
Click Connect.
-
Click Apply.
-
Click Untitled Explorer, and rename this report as Services Breakdown.
-
In the Setup pane, in the Metric section, hold the pointer over Record Count, and click X to remove that metric.
-
Click Add metric, and select num.
You may have to scroll down to see the num menu option.
-
In the Chart > Table pane, select the Pie chart.
Looker Studio generates a pie chart on the use of services.
-
Click Save.
Close the Looker Studio tab and return to the BigQuery console. You are now ready to answer the second question.
Question 2: Which regions are most and least used?
To find which regions are most and least used across all four projects, you must determine:
- Which regions the Google Cloud services ran in
- Which regions are most and least used
Query to determine which regions the Google Cloud services ran in
-
In the Query editor, clear the current query.
-
In the Query editor, type the following, and then click Run:
The location.region column lists the regions the Google Cloud service ran in.
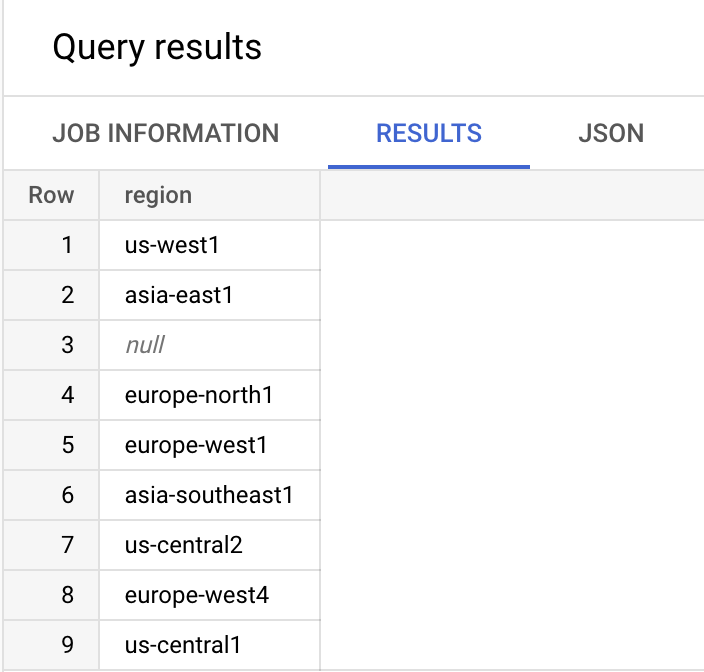
The example results above show that project resources ran in multiple regions. A null region means the region is not known.
Check my progress
Click Check my progress to verify your performed task. If you have successfully run a query to get the regions that the Google Cloud service ran in, you will see an assessment score.
Query to determine which regions are used the most and least
-
In the Query editor, clear the current query.
-
In the Query editor, type the following, and then click Run:
Your results should look similar to the example table below, but your actual query output will be different.
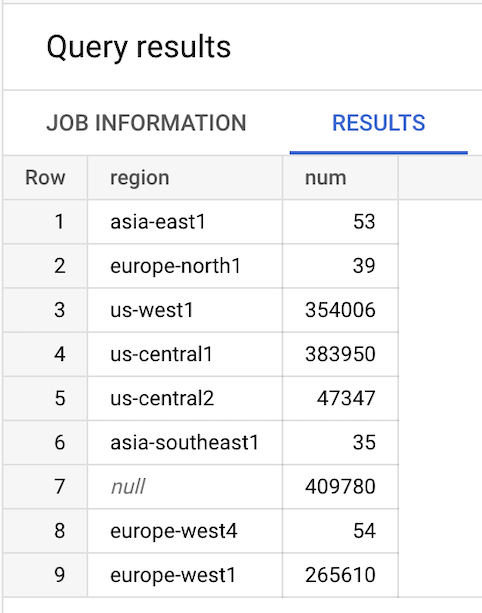
The example results show the variation of regions that are used most and least.
Check my progress
Click Check my progress to verify your performed task. If you have successfully run the query to find out which regions are used the most and the least by a service, you will receive an assessment score.
Create a Looker Studio visualization for regions
-
Open Looker Studio in a new tab.
-
Click Create > Explorer.
-
In the Add Data pane, click Create New Data.
-
In the Google Connectors window, select BigQuery.
-
In Recent Projects, select Custom Query.
-
In Billing Project, select your project ID.
-
Type the query you used previously:
-
Click Connect.
-
Click Apply.
-
Click Untitled Explorer, and rename this report to Regions Breakdown.
-
In the Setup pane, in the Metric section, hold the pointer over Record Count, and click X to remove that metric.
-
Click Add metric, and select num.
-
In the right menu Chart > Table pane, select the Pie chart table.
Looker Studio generates a pie chart on the use of services.
You have successfully created two data visualizations from your billing data queries.
-
Click SAVE in the top-right corner to save your visualization.
-
Click Looker Studio

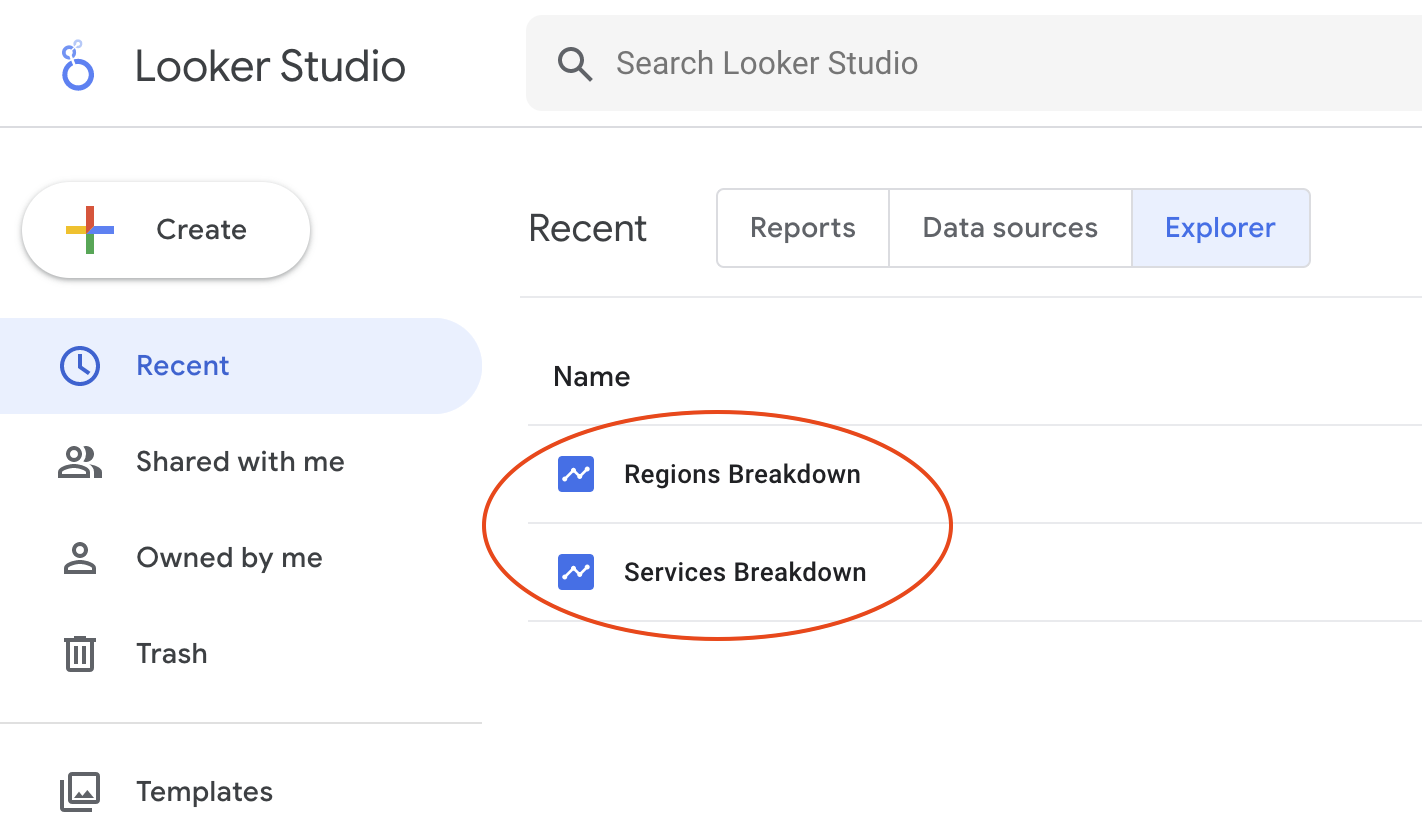
- To see the visualizations you just created, click the Looker Studio icon to the left of Regions Breakdown:
Congratulations!
In this lab you explored the billing service in the console and learned how to export your billing data to BigQuery. After exploring the data with SQL queries, you exported your aggregated data to Looker Studio, where you generated pie chart visualizations of service and region consumption. You are ready to take more labs in this series.
Finish your quest
This self-paced lab is part of the Understanding Your Google Cloud Costs quest. A quest is a series of related labs that form a learning path. Completing this quest earns you a badge to recognize your achievement. You can make your badge or badges public and link to them in your online resume or social media account. Enroll in this quest and get immediate completion credit. Refer to the Google Cloud Skills Boost catalog for all available quests.
Take your next lab
Take another lab in the Understanding Your Google Cloud Costs Quest:
Google Cloud training and certification
...helps you make the most of Google Cloud technologies. Our classes include technical skills and best practices to help you get up to speed quickly and continue your learning journey. We offer fundamental to advanced level training, with on-demand, live, and virtual options to suit your busy schedule. Certifications help you validate and prove your skill and expertise in Google Cloud technologies.
Manual Last Updated December 7, 2023
Lab Last Tested December 7, 2023
Copyright 2024 Google LLC All rights reserved. Google and the Google logo are trademarks of Google LLC. All other company and product names may be trademarks of the respective companies with which they are associated.